


TL;DR
- You need predictable observability costs and full-stack visibility without per-metric billing → netdata collects system, application, and infrastructure metrics in one agent, then visualizes locally or self-hosted, eliminating usage-based charges.
- Your team monitors scheduled jobs and background tasks at scale → healthchecks provides a lightweight, self-hosted cron monitoring service that tracks job completion and alerts on failure—no metric cardinality explosion.
- Engineering leadership wants to measure DORA metrics and deployment velocity → middleware is purpose-built for engineering teams to track deployment frequency, lead time, and change failure rate without the observability platform overhead.
Why teams leave Grafana Cloud
Grafana Cloud's free tier caps at 10,000 metric series and 50 GB of logs with 14-day retention. Once you exceed those limits—which happens quickly in production environments with high-cardinality metrics (e.g., per-container, per-request tags) or verbose application logs—you enter a consumption-based pricing model where the Pro plan adds a $19/month platform fee plus per-unit charges for metrics, logs, and traces. Teams with distributed systems, microservices, or chatty instrumentation watch their observability bills scale unpredictably with every new service or increased logging verbosity.
Beyond cost, there's the lock-in and control question. Your telemetry lives in Grafana's managed infrastructure, which creates data-sovereignty friction for regulated industries and limits your ability to query or export data on your own terms. Many teams realize that because Grafana itself is open-source and free to self-host, they can run the entire stack—Grafana + Prometheus for metrics, Loki for logs—on their own infrastructure, keep telemetry on-premises, and pay only for compute and storage they control. The trade-off is operational overhead; the payoff is predictable costs and full data ownership.
Quick comparison
| Name | License | Self-Hosted | Data Ownership | Query Flexibility | Best For |
|---|---|---|---|---|---|
| netdata | GPL-3.0 | Yes, fully | On-premises by default | PromQL-compatible; real-time dashboards | Full-stack infrastructure & app monitoring |
| healthchecks | BSD-3-Clause | Yes, fully | On-premises by default | Webhook-based alerting; no complex queries | Cron job and background task monitoring |
| middleware | Apache-2.0 | Yes, fully | On-premises by default | SQL-like queries on DORA metrics | Engineering team metrics and deployment tracking |
| debops | License not declared | Yes, fully | On-premises by default | Configuration-driven; no real-time queries | Debian infrastructure automation and provisioning |
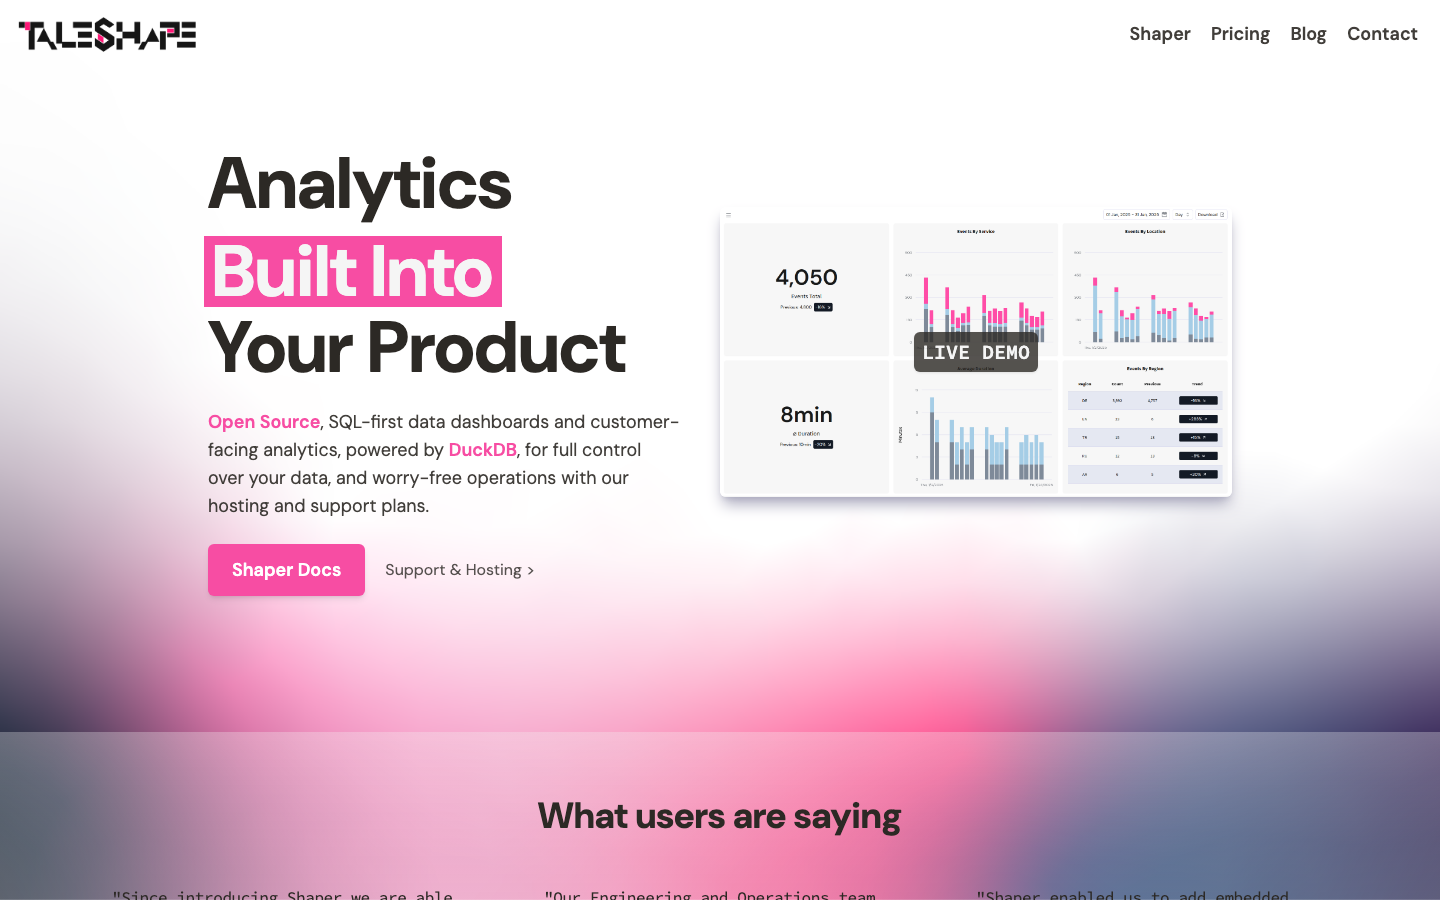
| shaper | MPL-2.0 | Yes, fully | On-premises by default | Full SQL via DuckDB; interactive visualizations | Data visualization and ad-hoc analytics |
Top open-source alternatives to Grafana Cloud
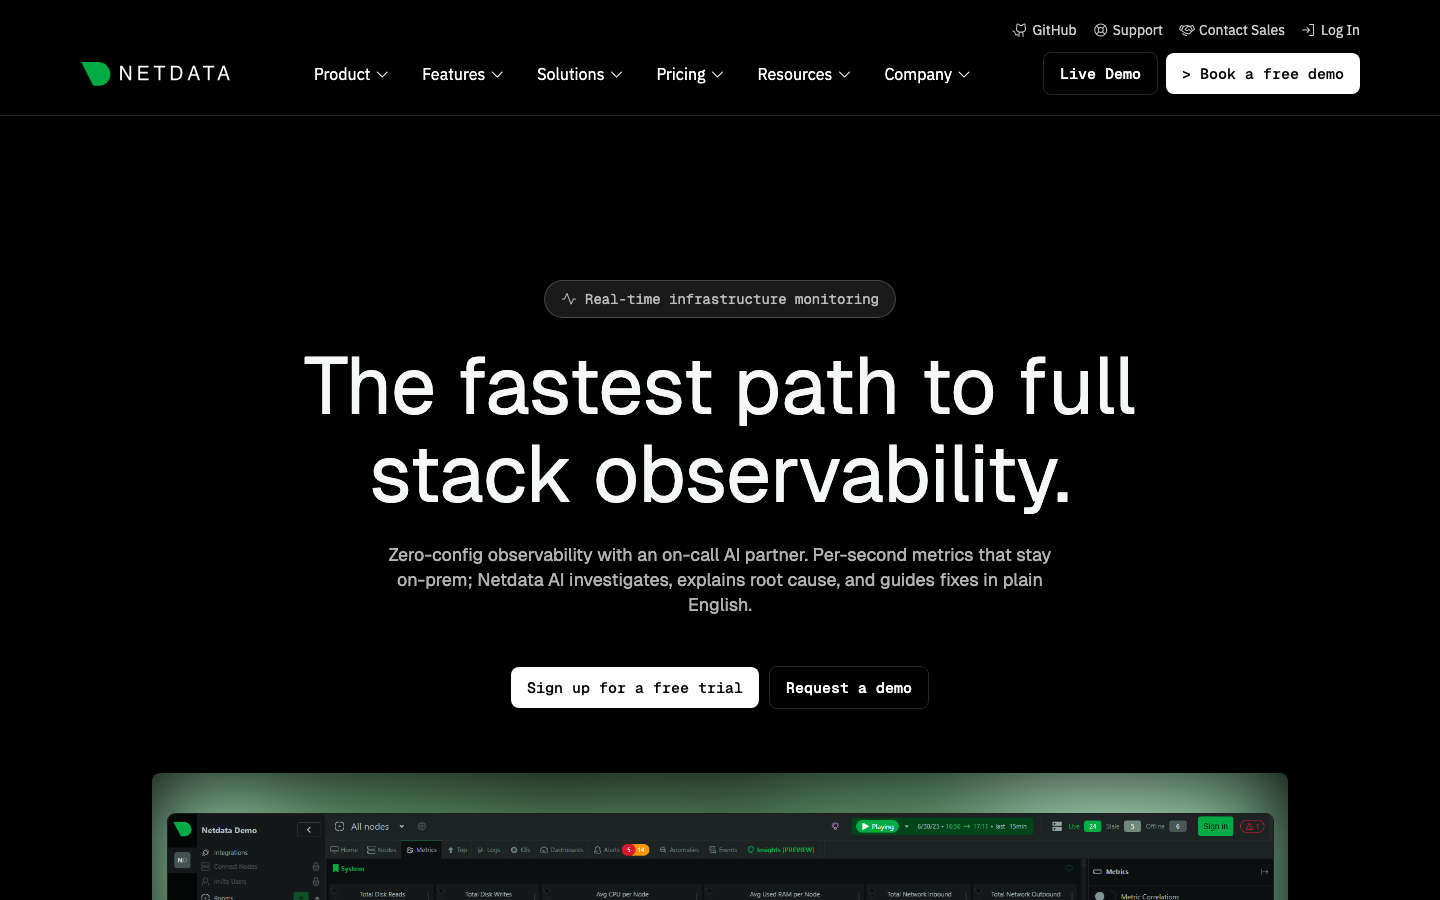
netdata
netdata is a distributed, real-time monitoring agent written in C that collects system, application, and infrastructure metrics at high resolution (1-second granularity by default) and visualizes them locally or via a self-hosted parent node. It auto-detects services, requires zero configuration for common workloads, and includes hundreds of pre-built dashboards and alerts. Unlike Grafana Cloud's metric-series billing model, netdata runs on your infrastructure and stores data locally, making it ideal for teams that want observability without consumption-based surprises.
Pros:
- Zero-configuration auto-discovery and pre-built dashboards reduce setup time and expertise required.
- Real-time, high-resolution metrics stored locally eliminate per-metric billing and data-sovereignty concerns.
- Lightweight agent footprint (C implementation) suitable for edge, embedded, and resource-constrained environments.
Cons:
- Operational responsibility for storage and retention policies on your infrastructure.
- Learning curve for advanced query customization compared to Grafana's UI-driven dashboard builder.
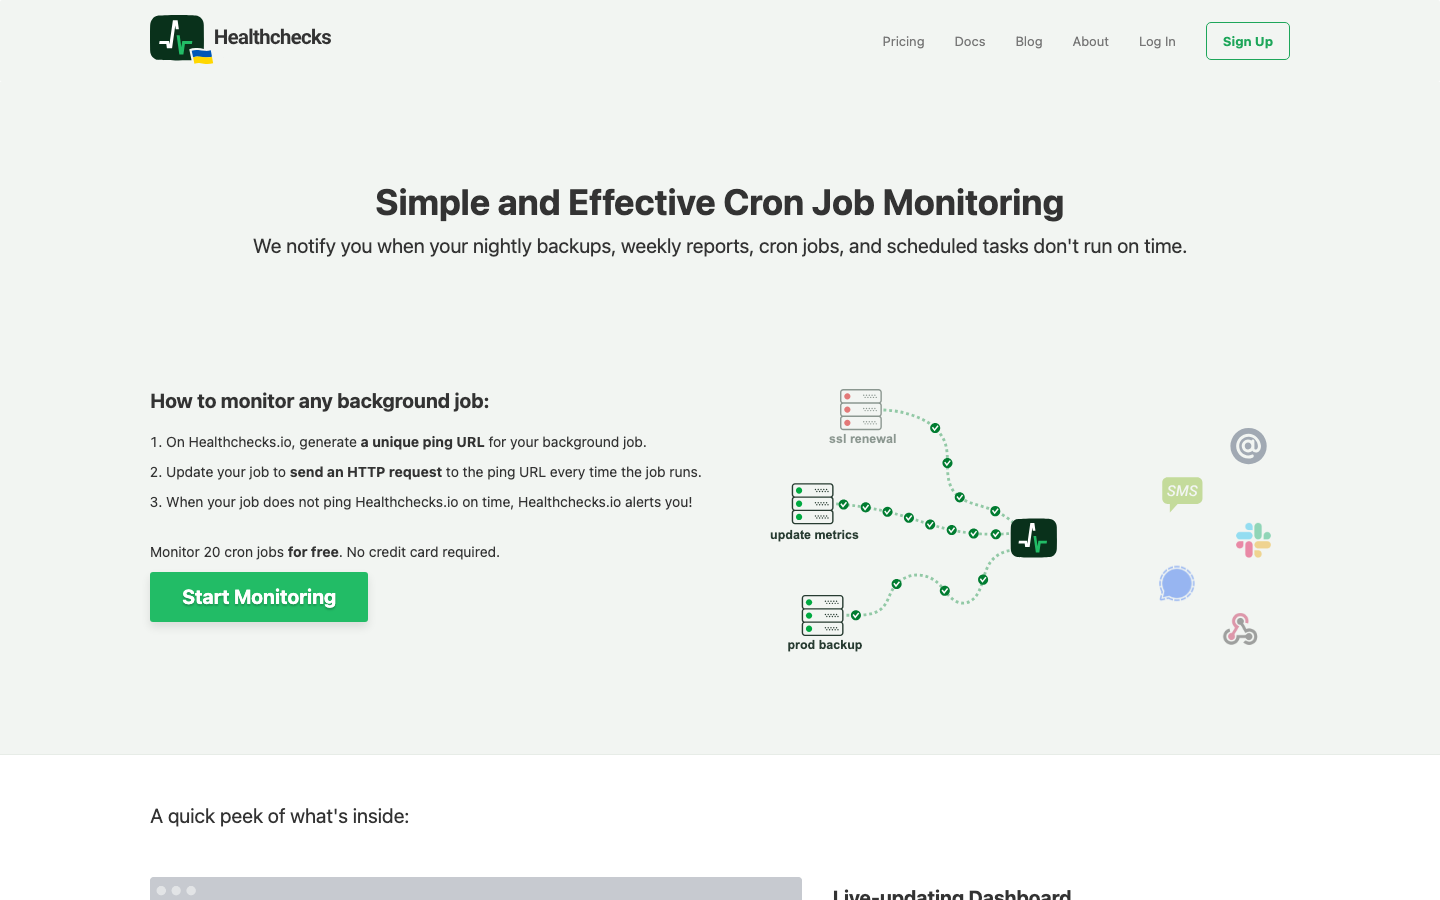
healthchecks
healthchecks is a Python/Django-based open-source service for monitoring cron jobs, scheduled tasks, and background workers. It provides a simple HTTP check API: your job pings a unique URL on completion, and healthchecks alerts you if the ping is late or missing. It's purpose-built for the observability gap that generic monitoring platforms overlook—ensuring your batch jobs, backups, and async workers actually run when expected.
Pros:
- Dead simple integration: add one HTTP request to your cron job or task runner.
- Eliminates false positives from log parsing or metric threshold tuning; presence/absence logic is bulletproof.
- Negligible resource overhead compared to agent-based monitoring.
Cons:
- Limited to job/task completion signals; not suitable for continuous application metrics or logs.
- Requires your jobs to be network-reachable or have outbound HTTP access.
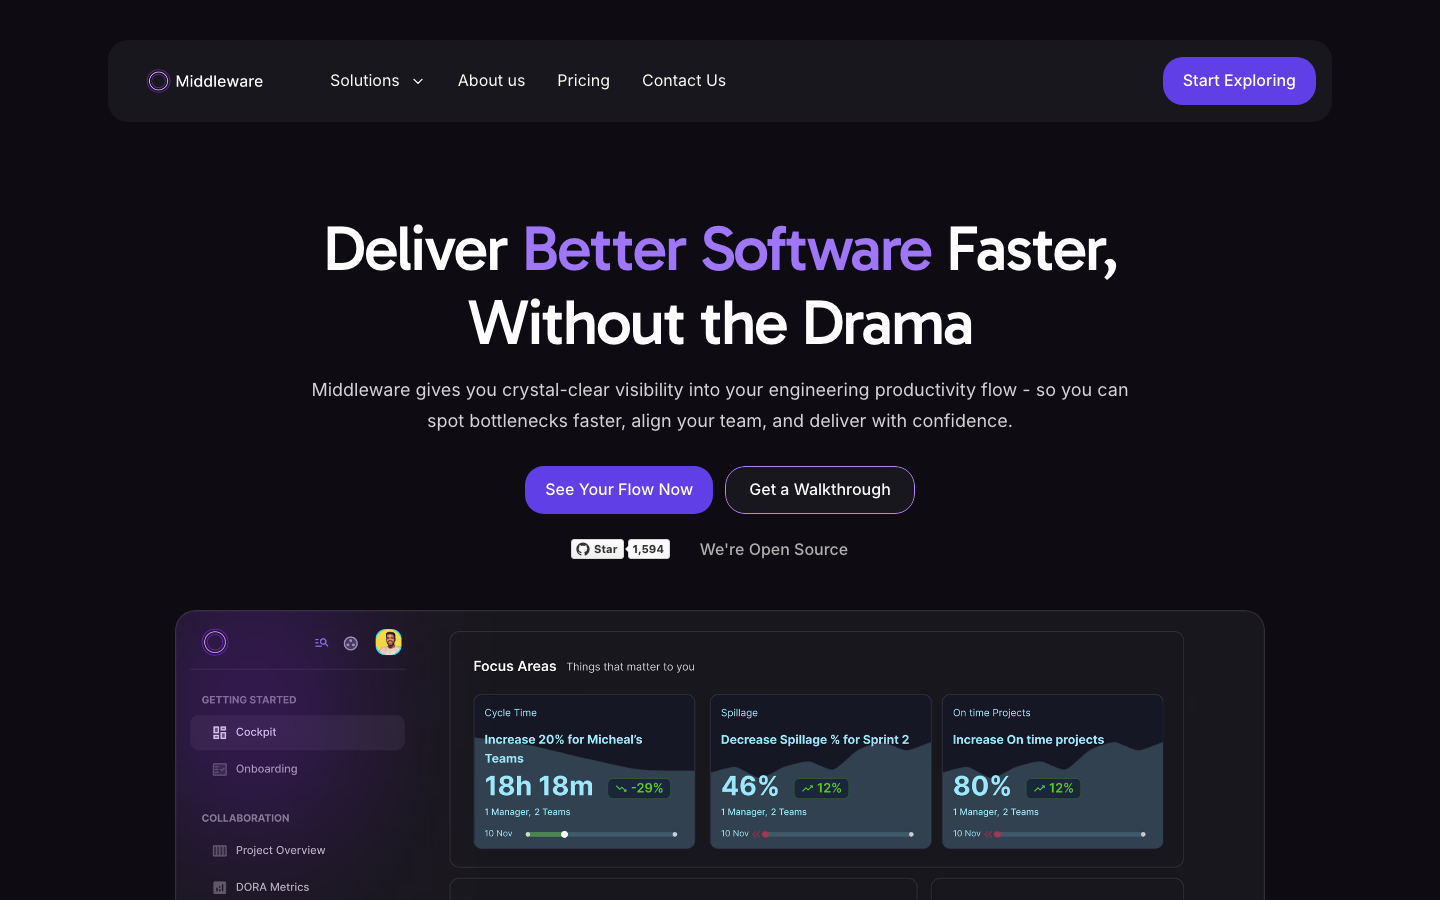
middleware
middleware is a TypeScript-based DORA metrics platform designed specifically for engineering teams. It tracks deployment frequency, lead time for changes, change failure rate, and mean time to recovery—metrics that matter to engineering leadership but are orthogonal to infrastructure observability. It integrates with Git, CI/CD pipelines, and incident management tools to surface engineering velocity and quality signals.
Pros:
- Purpose-built for DORA metrics; no need to cobble together custom dashboards across Grafana, Jira, and Git.
- Directly ties deployment and code-quality data to business outcomes (cycle time, reliability).
Cons:
- Narrowly focused on engineering metrics; not a replacement for infrastructure or application monitoring.
- Requires integration with your CI/CD and Git infrastructure to populate data.
debops
debops is a Debian-focused infrastructure-as-code framework written in Jinja that automates datacenter provisioning, configuration, and hardening. It's less a monitoring tool and more a declarative infrastructure orchestration layer that can codify your entire Debian-based stack—including monitoring agent deployment and configuration.
Pros:
- Comprehensive Debian automation reduces manual infrastructure toil.
- Integrates well with Ansible; idempotent and version-controllable.
Cons:
- Steep learning curve for teams unfamiliar with Ansible/Jinja templating.
- Not a monitoring or analytics platform on its own; complements rather than replaces observability tools.
shaper
shaper is a Go-based data visualization tool powered by DuckDB, allowing you to write SQL queries directly against your datasets and generate interactive dashboards. It's lightweight, runs entirely on your infrastructure, and supports ad-hoc analytics without the overhead of a full observability platform.
Pros:
- Full SQL expressiveness via DuckDB; no metric-series cardinality limits or query restrictions.
- Fast, self-contained binary suitable for embedded analytics or internal BI.
Cons:
- Requires manual data ingestion (no built-in agents or collectors); best for batch or pre-aggregated datasets.
- Not purpose-built for real-time streaming metrics; better suited to historical or analytical queries.
How to choose
For full-stack infrastructure and application monitoring at scale: choose netdata. It's the most direct Grafana Cloud replacement—auto-discovering services, generating dashboards, and storing metrics on your infrastructure without per-metric costs.
For engineering teams focused on deployment velocity and quality: middleware is your pick. It surfaces DORA metrics and cycle-time data that generic monitoring platforms bury or omit.
For cron and background-job reliability: healthchecks is lightweight and bulletproof. Add it alongside your primary monitoring stack to close the gap on scheduled-task observability.
For ad-hoc analytics and custom BI queries: shaper gives you SQL-powered dashboards without metric cardinality restrictions, ideal for teams that need flexible querying over pre-aggregated or historical data.
For infrastructure automation first: debops codifies your entire Debian stack, including monitoring setup, reducing manual configuration drift—pair it with netdata or healthchecks for observability.