


TL;DR
- Control your costs: Prometheus eliminates per-GB ingestion charges and per-user fees by running on your infrastructure, letting you scale telemetry without surprise overages.
- Keep your data: Netdata offers self-hosted deployment so your observability stack never leaves your network, critical for regulated industries and data-sovereignty requirements.
- Own your platform: Sentry provides error tracking and performance monitoring under your control, avoiding the vendor lock-in of cloud-only SaaS observability.
Why teams leave New Relic
New Relic's usage-based pricing model creates a cost problem that compounds with scale. You pay for data ingested (in GB) plus per-user licensing for full-platform access—meaning teams that instrument heavily or grow their engineering staff face ballooning bills. The real pain arrives when data volume spikes unexpectedly: overages on ingest can blindside teams mid-quarter, forcing difficult choices between cutting instrumentation (losing observability) or absorbing the charge.
Beyond cost, New Relic's cloud-only architecture creates friction for teams with data-sovereignty concerns or regulatory constraints. All telemetry flows to New Relic's managed cloud; there's no self-hosting option, no air-gap deployment, and no way to keep sensitive observability data on-premises. For organizations in regulated industries—finance, healthcare, government—or those operating in restricted regions, this is a hard blocker. You're also locked into New Relic's query language, dashboard UI, and data retention policies; migrating away means rebuilding your entire observability layer from scratch.
Quick comparison
| Name | License | Self-Hosted | Data Ownership | Query Flexibility | Best For |
|---|---|---|---|---|---|
| Netdata | GPL-3.0 | ✓ Yes | On-premises | Custom dashboards, ML-driven alerts | Full-stack observability on your infrastructure |
| Prometheus | Apache-2.0 | ✓ Yes | On-premises | PromQL, flexible time-series queries | Metrics collection and alerting at scale |
| Sentry | License not declared | ✓ Yes | On-premises | Event filtering, custom tags, SDK flexibility | Error tracking and performance monitoring |
| PM2 | License not declared | ✓ Yes | On-premises | Process-level metrics, custom dashboards | Node.js application process management |
| PostHog | License not declared | ✓ Yes | On-premises | SQL queries, custom events, session replay | Product analytics, feature flags, and experimentation |
| GoAccess | MIT | ✓ Yes | On-premises | Log parsing, real-time filtering | Web server log analysis and visualization |
| Druid | Apache-2.0 | ✓ Yes | On-premises | SQL, custom aggregations, sub-second queries | Real-time analytics on large datasets |
| Healthchecks | BSD-3-Clause | ✓ Yes | On-premises | Simple HTTP checks, custom alerting | Cron job and background task monitoring |
Top open-source alternatives to New Relic
Netdata
The fastest path to full-stack observability for teams of any size. Netdata collects metrics from your infrastructure, applications, and services in real-time, then applies AI-powered anomaly detection and alerting out of the box. It's lightweight enough to run on edge devices and scales to monitor entire fleets from a single dashboard.
Pros:
- Self-hosted by default with zero per-user or per-GB licensing; costs are fixed infrastructure spend, not variable with telemetry volume
- AI-powered insights and anomaly detection built in, reducing alert fatigue and manual tuning
- Instant dashboards and visualizations require minimal configuration
Cons:
- Steeper learning curve for teams used to managed SaaS platforms
- Requires operational overhead to maintain and upgrade
Prometheus
The industry-standard time-series database and metrics collection system. Prometheus scrapes metrics from instrumented applications and infrastructure, stores them locally, and provides a powerful query language (PromQL) for alerting and dashboarding. It's the backbone of observability stacks at scale.
Pros:
- Completely self-hosted with no licensing fees; you control retention, query limits, and data access
- PromQL is expressive and widely understood; integrates with thousands of exporters and tools
- Pull-based scraping model reduces agent complexity and network overhead
Cons:
- Requires additional tools (Grafana, Alertmanager, etc.) to replicate New Relic's full feature set
- Time-series storage is less suited to high-cardinality event data or unstructured logs
Sentry
A developer-first error tracking and performance monitoring platform that captures exceptions, stack traces, and slow transactions across your stack. Sentry groups related errors, provides context (user sessions, breadcrumbs, environment), and integrates deeply with development workflows.
Pros:
- Self-hosted deployment keeps error and performance data on your infrastructure
- Developer experience is polished; minimal SDK setup required to start capturing errors
- Powerful error grouping and filtering reduce noise and speed up debugging
Cons:
- Narrower scope than New Relic; focused on errors and transaction performance, not full infrastructure observability
- High-cardinality event filtering can require careful tuning to control storage costs
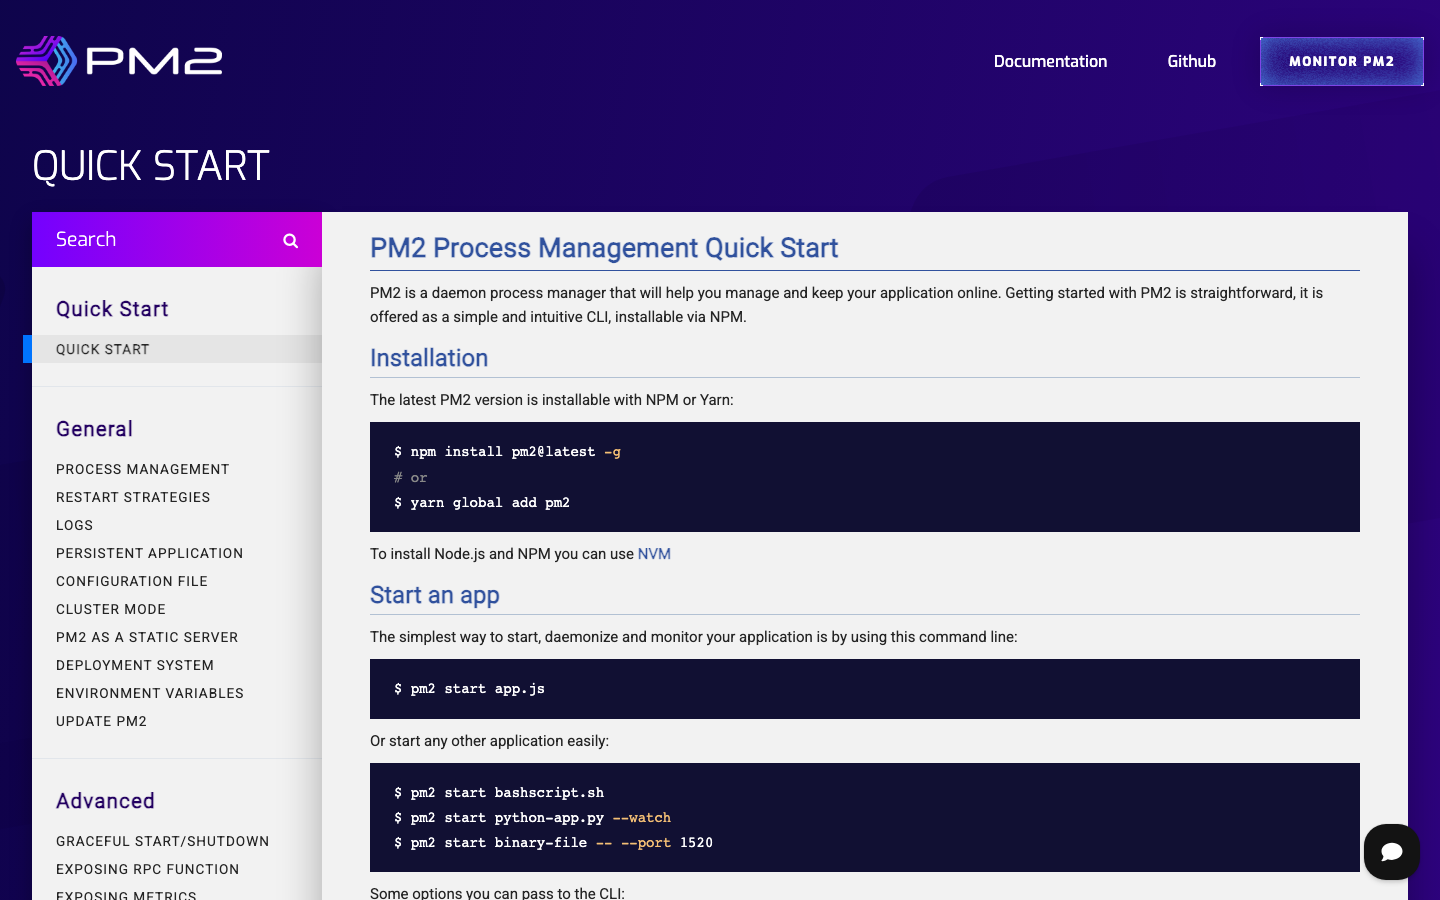
PM2
A production process manager for Node.js applications with built-in monitoring, clustering, and load balancing. PM2 keeps your Node apps running, restarts them on crashes, and provides real-time metrics on CPU, memory, and request throughput.
Pros:
- Lightweight and purpose-built for Node.js; minimal overhead compared to agent-based monitoring
- Includes process clustering and zero-downtime reloads, reducing operational friction
- Simple CLI and web dashboard get teams monitoring quickly
Cons:
- Limited to Node.js; not a general-purpose observability platform
- Metrics are process-level only; lacks distributed tracing and cross-service correlation
PostHog
An all-in-one developer platform combining product analytics, web analytics, session replay, error tracking, feature flags, experimentation, and surveys. PostHog is designed for product teams to understand user behavior and ship features faster.
Pros:
- Self-hosted; keeps product and customer data on your infrastructure
- Unified platform reduces tool sprawl; analytics, feature flags, and error tracking in one stack
- SQL-based querying on custom events provides flexibility for non-standard use cases
Cons:
- Broader scope means it's not a deep fit for infrastructure or application performance monitoring
- Requires more operational complexity than single-purpose tools
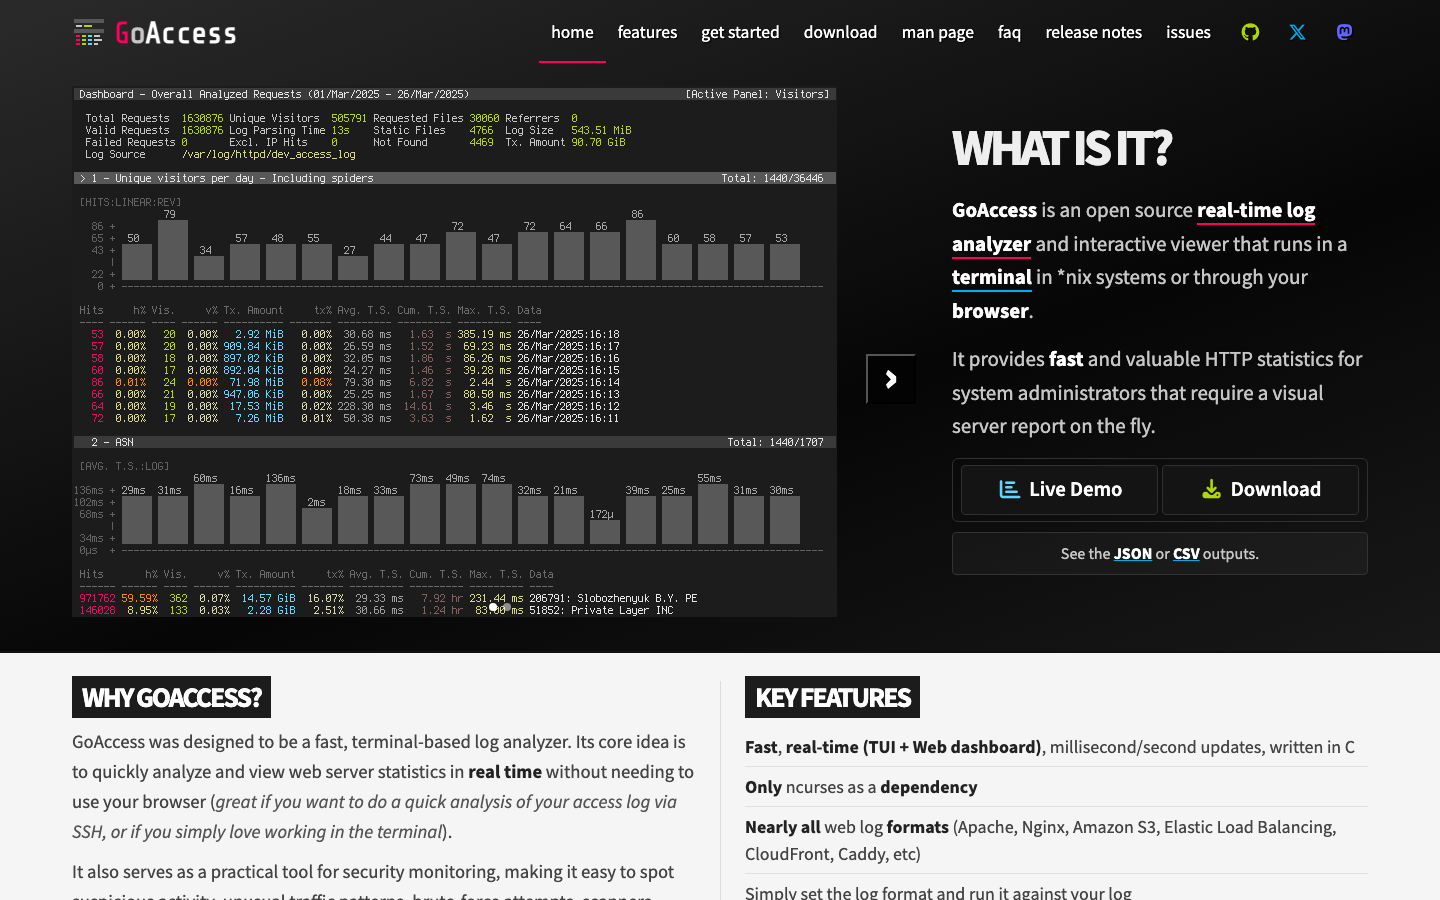
GoAccess
A real-time web log analyzer that parses server access logs and renders interactive dashboards in your terminal or browser. GoAccess is lightweight and fast, making it ideal for quick log analysis without external dependencies.
Pros:
- Extremely lightweight and fast; processes logs in real-time with minimal CPU overhead
- No database required; works directly on log files or stdin
- Terminal and HTML output modes suit both quick debugging and presentation
Cons:
- Limited to HTTP access logs; not a general-purpose observability platform
- No alerting, distributed tracing, or multi-server aggregation
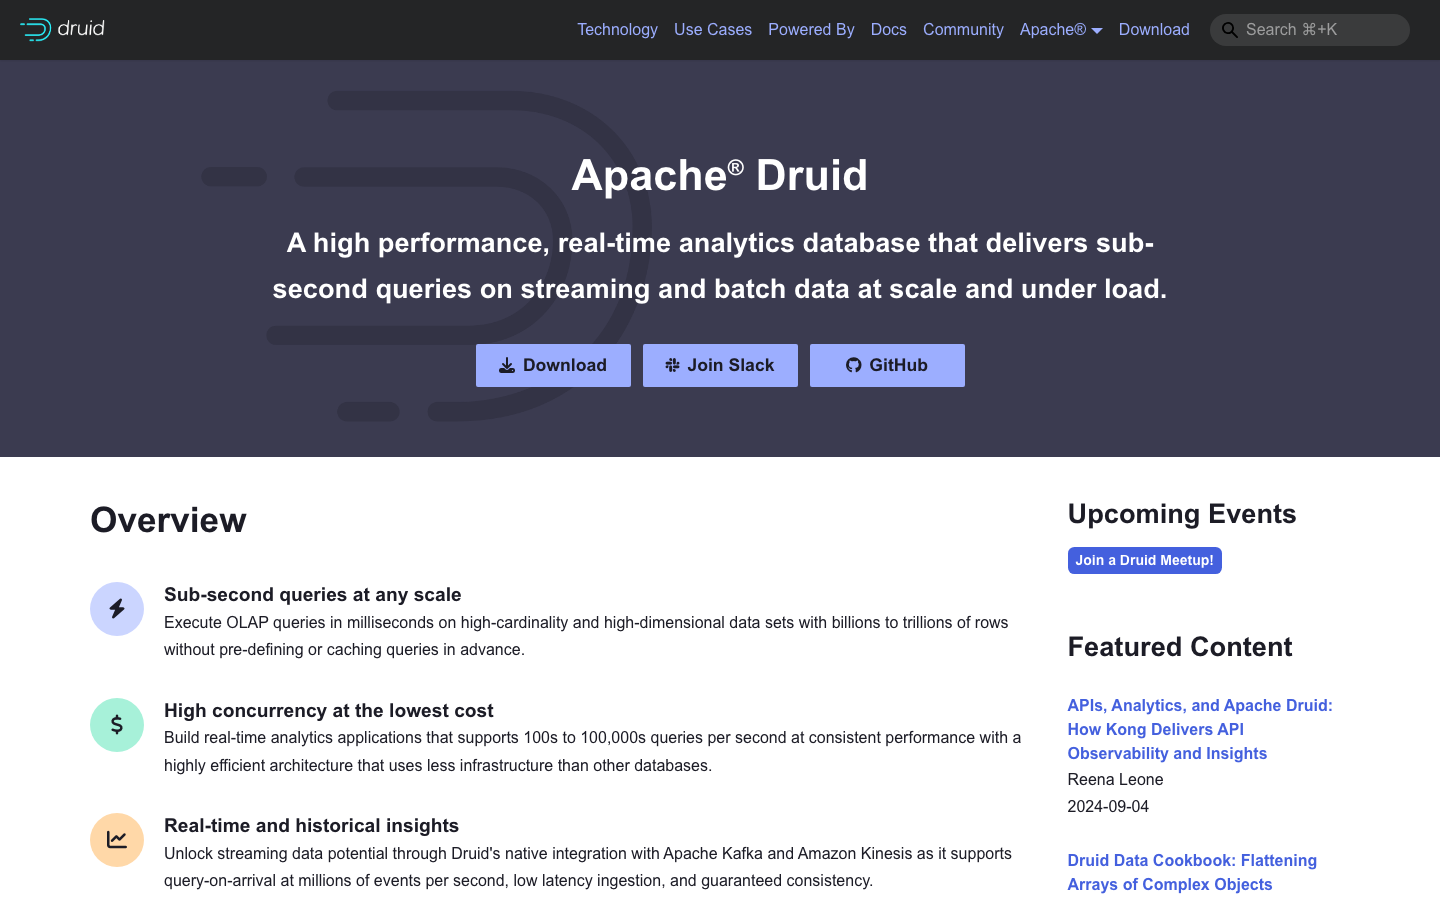
Druid
A high-performance real-time analytics database designed for OLAP queries on large, streaming datasets. Druid ingests events continuously, indexes them for sub-second query latency, and scales horizontally.
Pros:
- Sub-second query latency on billions of events; built for high-cardinality data
- SQL-based querying is familiar to analytics teams
- Self-hosted and fully open-source; no per-query or per-user licensing
Cons:
- Operational complexity; requires cluster setup, tuning, and maintenance
- Steeper learning curve than managed observability platforms; best suited to teams with data infrastructure expertise
Healthchecks
An open-source cron job and background task monitoring service. Healthchecks lets you define expected check-in intervals, then alerts you when jobs miss their window—a simple but effective way to catch stuck or failed background processes.
Pros:
- Dead simple to integrate; just HTTP POST to a unique URL when your job completes
- Self-hosted; no third-party dependency for critical alerting
- Minimal operational overhead; lightweight Python/Django stack
Cons:
- Narrowly scoped to cron and task monitoring; not a replacement for broader observability
- No metrics, logs, or traces; purely check-in based
How to choose
Start with your primary pain point: if costs are out of control, Prometheus or Netdata eliminate per-GB and per-user billing entirely. If data sovereignty is the blocker, any of these projects give you on-premises deployment and full data ownership. For error tracking and application performance, Sentry is a direct alternative; for product and user analytics, PostHog replaces that piece of New Relic. For Node.js-only teams, PM2 is lighter weight. Most teams will combine multiple tools—Prometheus for infrastructure metrics, Sentry for errors, Druid or PostHog for analytics—rather than adopt a single all-in-one replacement.