
The Prometheus monitoring system and time series database.
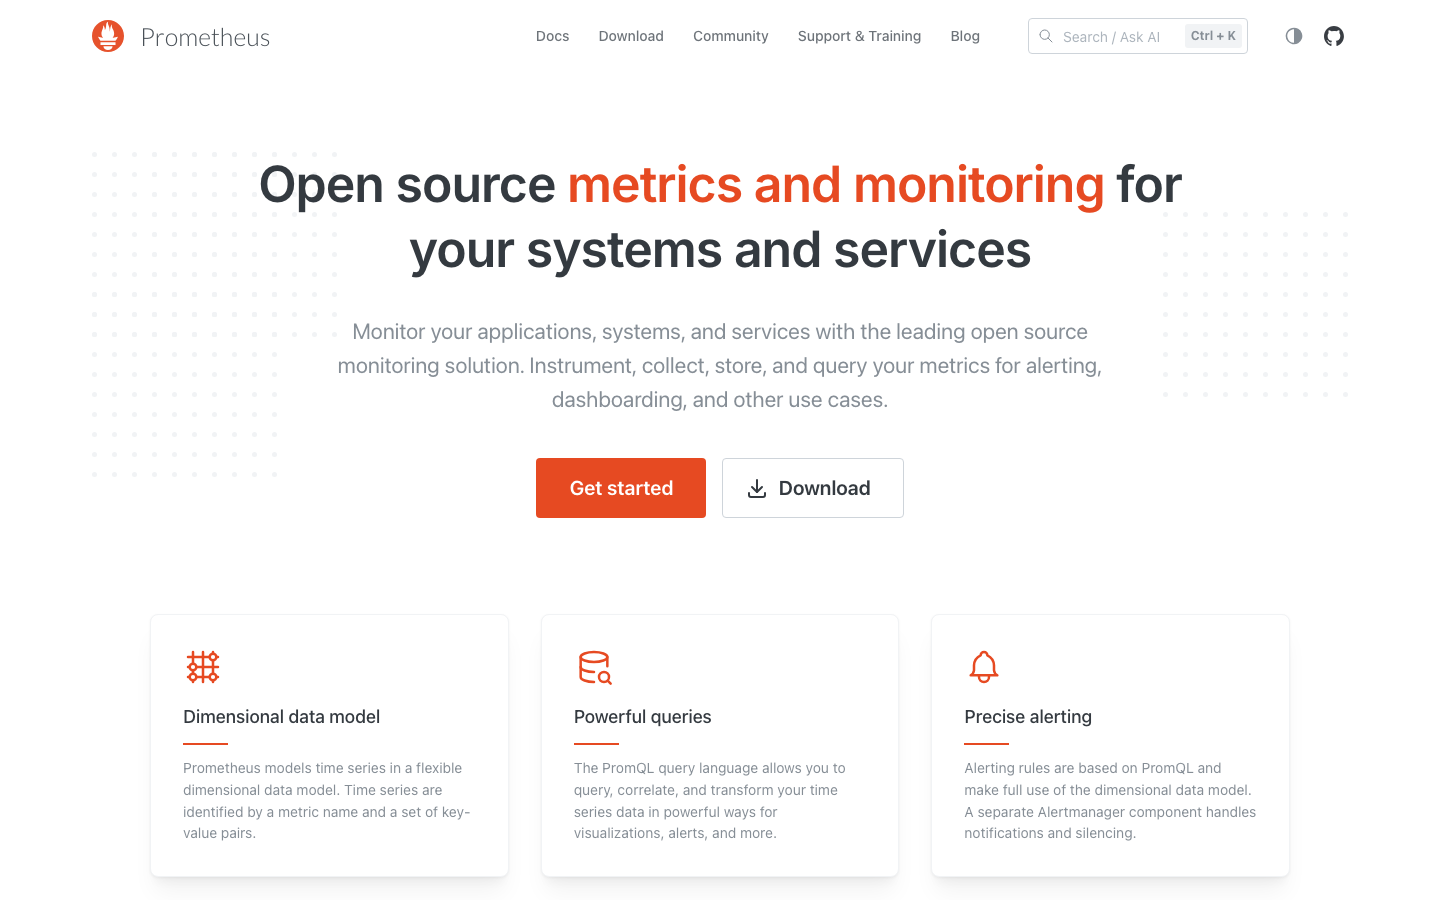
Prometheus is a Cloud Native Computing Foundation project that provides systems and service monitoring with a powerful time series database. It collects metrics from configured targets, evaluates rule expressions, and triggers alerts when specified conditions are observed, offering a flexible and scalable alternative to traditional monitoring systems.
Developers, DevOps engineers, and SREs who need a reliable, scalable monitoring solution for cloud-native environments. Organizations of any size deploying containerized applications or microservices benefit from Prometheus's autonomous architecture and powerful querying capabilities.

A fancy self-hosted monitoring tool

The fastest path to AI-powered full stack observability, even for lean teams.

The open and composable observability and data visualization platform. Visualize metrics, logs, and traces from multiple sources like Prometheus, Loki, Elasticsearch, InfluxDB, Postgres and many more.

Real-time global intelligence dashboard. AI-powered news aggregation, geopolitical monitoring, and infrastructure tracking in a unified situational awareness interface
ClickHouse® is a real-time analytics database management system
Developer-first error tracking and performance monitoring
