












TL;DR
- Infrastructure and application teams who need real-time full-stack visibility without vendor lock-in should start with Prometheus + Grafana, the industry standard for metrics and dashboards.
- SRE and DevOps teams managing container-heavy or Kubernetes environments will find Netdata fastest to deploy—it profiles the entire stack with minimal configuration and runs self-hosted.
- Teams tracking errors, performance, and user behavior across web and backend should evaluate SigNoz as a Datadog alternative that bundles logs, traces, and metrics in one platform without surprise billing.
Why teams leave Datadog
A DevOps team enables detailed logging across their microservices to debug a production incident. Three weeks later, the bill arrives: log ingestion alone has tripled because a code change increased event volume by 40%. They're locked into Datadog's cloud, can't move the data, and the contract renews at peak usage—not average.
This is the core friction teams hit: Datadog's pricing is built on complexity and peak usage, not value delivered.
The platform bills across roughly 20 separate SKUs—infrastructure hosts, APM hosts, log ingestion, retention windows, synthetics, container overages—each with its own committed monthly floor. A traffic spike doesn't just cost more; it resets your baseline for next month's bill. Log management alone can run $2.50–3.75 per million events for 30-day retention, and teams have little visibility into what will actually cost until the invoice arrives. There's also a hard rule: if you monitor more than five containers per host (extremely common in modern deployments), you pay a premium, and every APM host requires infra monitoring whether you need it or not.
Equally limiting: your data lives in Datadog's cloud. There's no self-hosted option, no data-residency control, and no way to query your own logs and metrics without going through Datadog's interface. For regulated industries, multi-tenant environments, or teams that simply want portability, this is a dealbreaker.
The result is teams either over-provision to avoid surprise bills, under-instrument to control costs, or spend engineering time building custom sampling and retention policies—all to work around the vendor's pricing model rather than solve their monitoring problem.
Quick comparison
| Name | License | Self-Hosted | Data Ownership | Query Flexibility | Best For |
|---|---|---|---|---|---|
| Uptime Kuma | MIT | ✅ Yes | ✅ Full | Basic (status pages) | Endpoint monitoring & alerts |
| Netdata | GPL-3.0 | ✅ Yes | ✅ Full | High (metrics querying) | Real-time infrastructure observability |
| Grafana | AGPL-3.0 | ✅ Yes | ✅ Full | Very High (multi-source) | Dashboards & visualization layer |
| Prometheus | Apache-2.0 | ✅ Yes | ✅ Full | High (PromQL) | Metrics collection & time-series DB |
| ClickHouse | Apache-2.0 | ✅ Yes | ✅ Full | Very High (SQL) | High-volume analytics & log storage |
| Sentry | License not declared | ✅ Yes | ✅ Full | Medium (error-focused) | Error tracking & performance monitoring |
| PostHog | License not declared | ✅ Yes | ✅ Full | High (product & event analytics) | Product analytics, feature flags, session replay |
| SigNoz | License not declared | ✅ Yes | ✅ Full | High (logs, traces, metrics) | APM & full observability alternative to Datadog |
Top open-source alternatives to Datadog
Uptime Kuma
A self-hosted monitoring tool focused on endpoint uptime and status pages. It's lightweight, runs on a single machine, and requires minimal setup—ideal for teams that need alerting without infrastructure overhead.
Pros
- Dead simple to deploy and operate; no external dependencies
- Beautiful status page UI for public incident communication
- Supports multiple notification channels (Slack, email, webhooks, etc.)
Cons
- Limited to uptime/endpoint monitoring; doesn't collect metrics or logs
- Not a full observability platform—better as a supplement than replacement
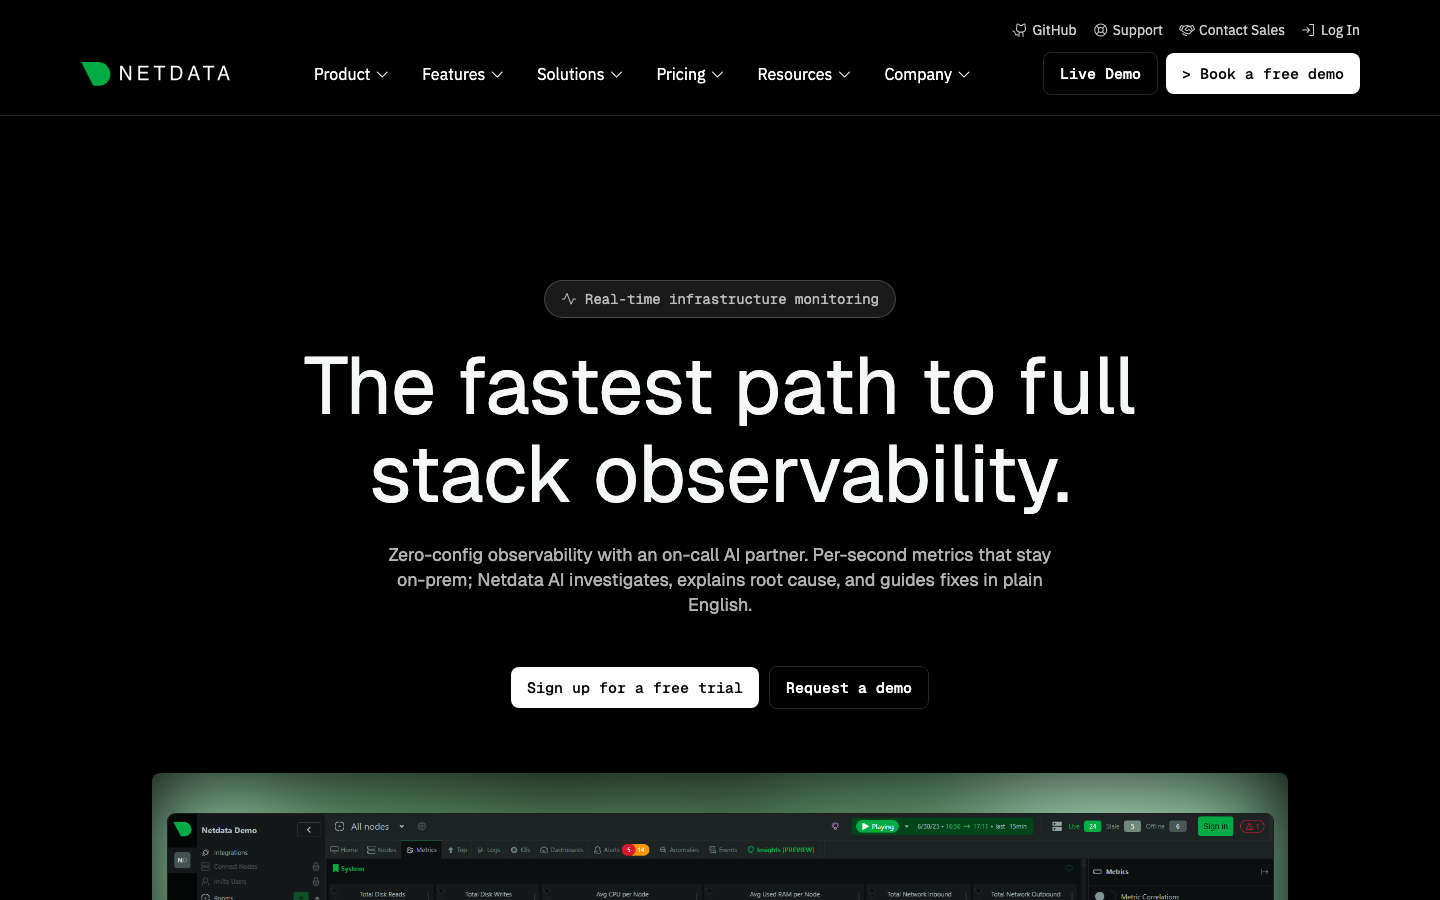
Netdata
A real-time monitoring agent that profiles the entire system stack—CPU, memory, disk, network, containers, applications—with zero configuration and AI-powered anomaly detection. Runs on every host and streams metrics to a local or centralized dashboard.
Pros
- Instant visibility with minimal setup; auto-discovers services and containers
- Extremely lightweight agent; designed for resource-constrained environments
- Full data ownership; can run completely offline or self-hosted
Cons
- Steeper learning curve for teams used to Grafana's dashboard builder
- Requires separate log aggregation solution (doesn't include log management)
Grafana
The industry-standard open-source visualization and dashboarding platform. Connects to any data source—Prometheus, Loki, Elasticsearch, InfluxDB, Postgres—and transforms metrics, logs, and traces into interactive dashboards and alerts.
Pros
- Unmatched flexibility; works with any monitoring backend
- Rich alerting and annotation features; large community ecosystem
- Self-hosted or managed cloud option; full data control
Cons
- Requires a separate metrics or logs backend; not an all-in-one system
- Dashboard creation has a learning curve for non-technical users
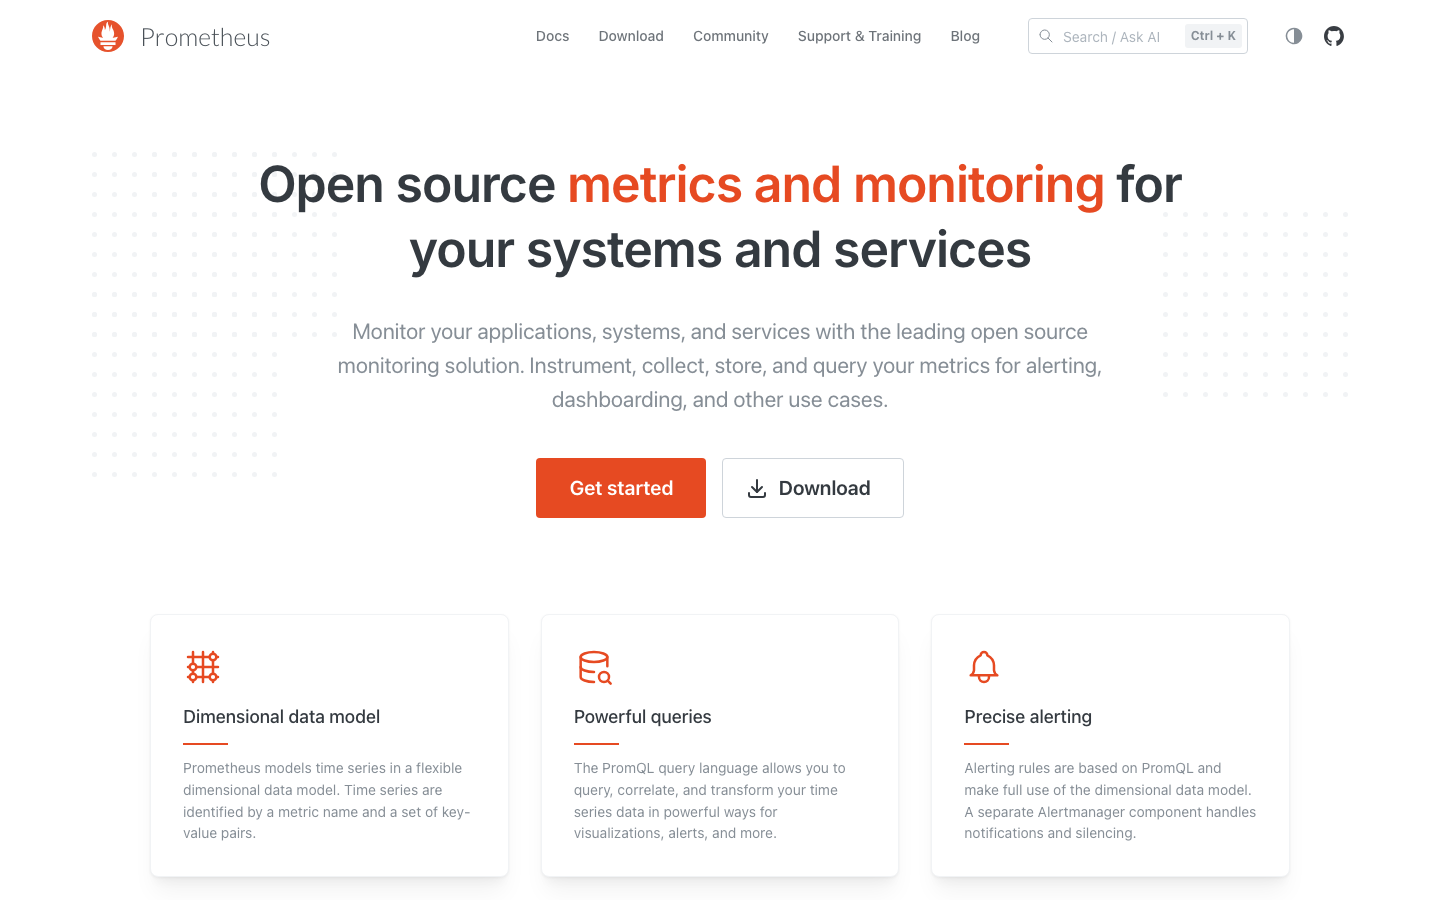
Prometheus
The de facto open-source metrics collection and time-series database. Scrapes metrics from instrumented applications and infrastructure, stores them locally, and exposes a powerful query language (PromQL) for analysis and alerting.
Pros
- Industry standard; works with every major observability tool
- Simple, reliable pull-based model; easy to reason about what's being collected
- Minimal resource footprint; runs on commodity hardware
Cons
- Metrics only; you need separate tools for logs and traces
- Limited built-in dashboard UI; almost always paired with Grafana
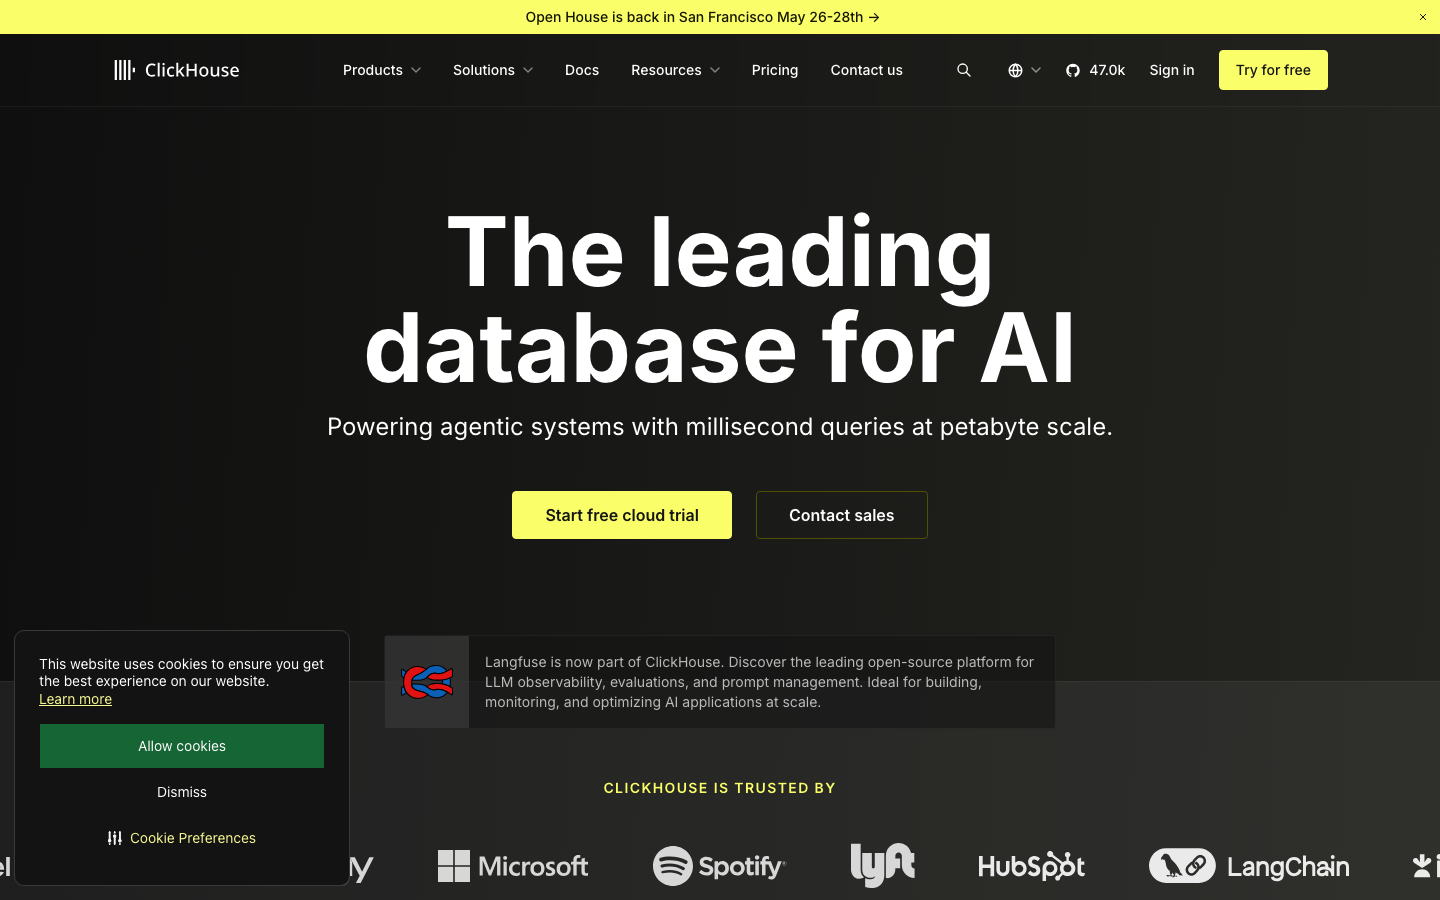
ClickHouse
A columnar SQL database optimized for real-time analytics on massive event volumes. Ingests and queries billions of rows with sub-second latency, making it ideal for log storage, event analytics, and time-series workloads at scale.
Pros
- Handles petabyte-scale data with fast SQL queries; no sampling needed
- Extremely cost-effective for high-volume log and event storage
- Full SQL support; familiar query language for analytics teams
Cons
- Requires operational expertise to deploy and tune
- Not a complete observability platform; needs integration with collection agents and visualization tools
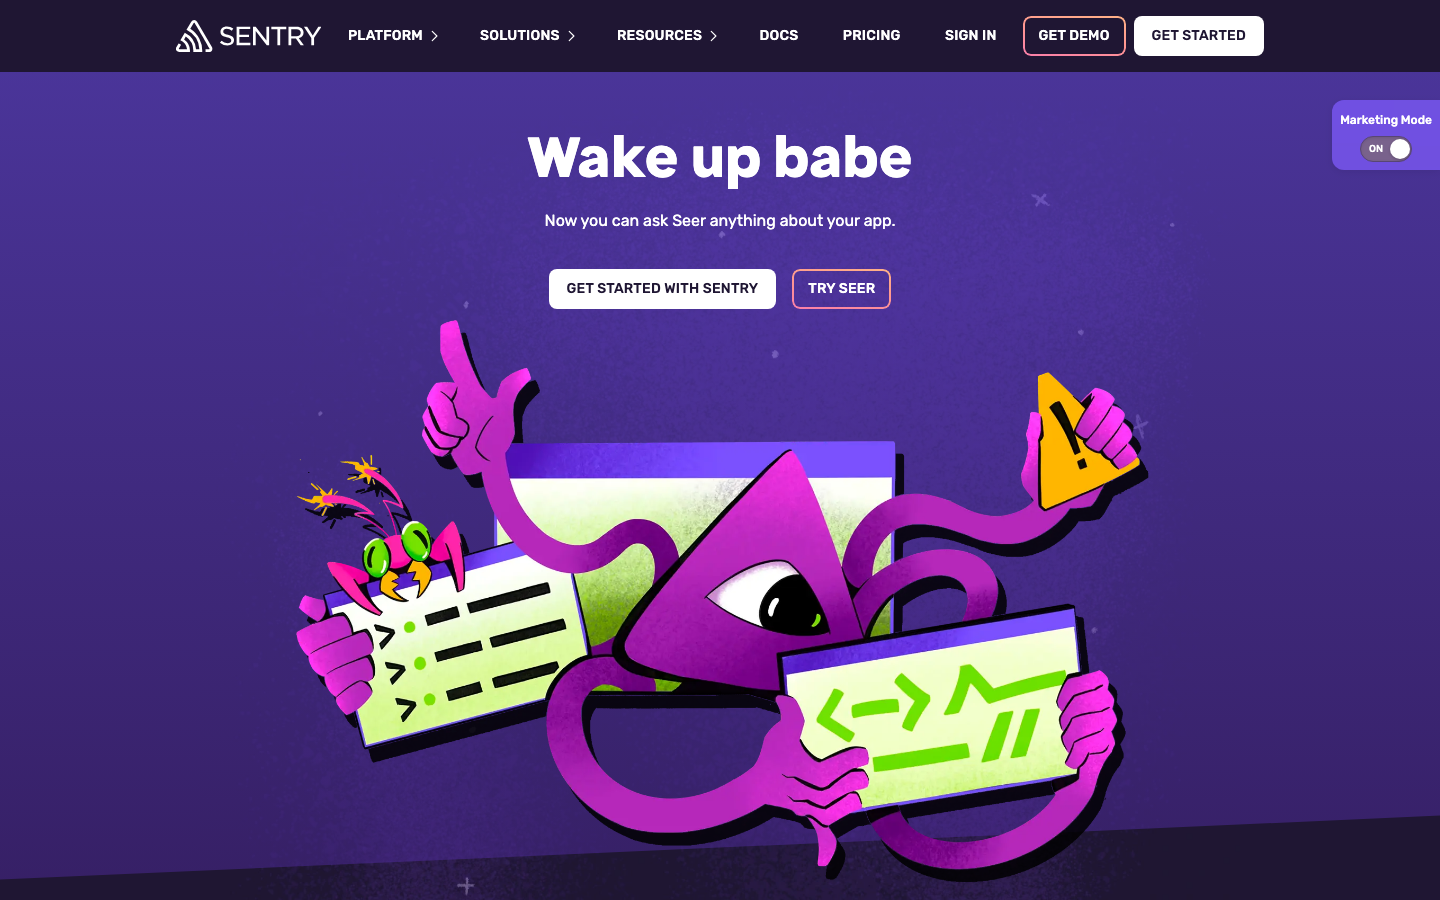
Sentry
A developer-first error tracking and performance monitoring platform. Captures exceptions, stack traces, and performance data from web and mobile applications, then surfaces trends and regressions in real time.
Pros
- Purpose-built for error and performance tracking; excellent context and grouping
- Tight integrations with popular frameworks and CI/CD pipelines
- Self-hosted or managed; transparent error replay and session context
Cons
- Focused on application errors; not a full infrastructure monitoring solution
- Limited log aggregation and metrics capabilities compared to Datadog
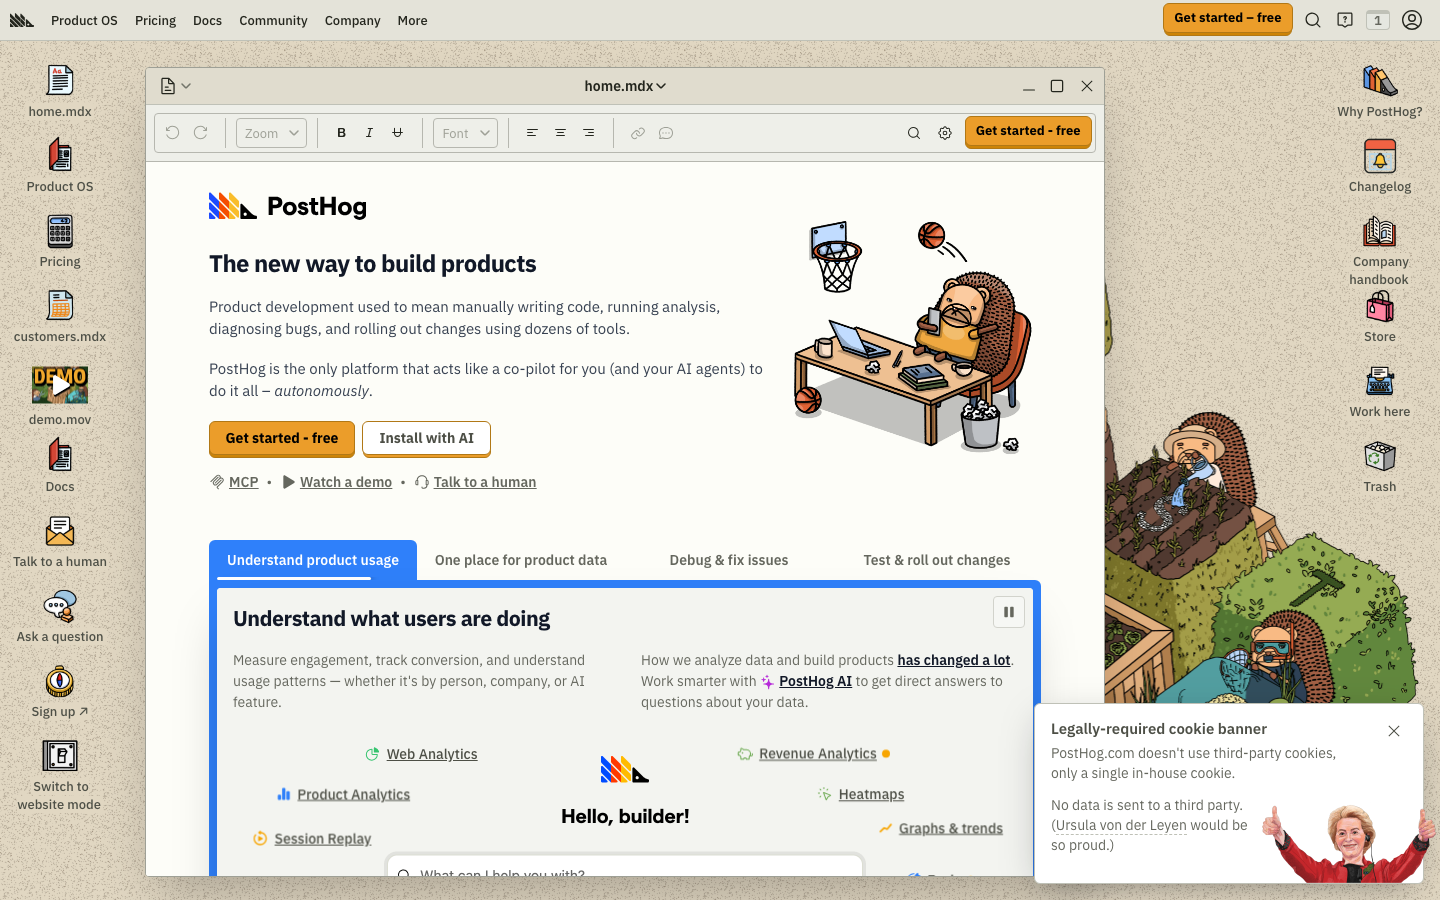
PostHog
An all-in-one product analytics and data platform. Combines event capture, session replay, error tracking, feature flags, experimentation, and a built-in data warehouse in a single stack, with full data residency control.
Pros
- Single platform for product analytics, feature flags, and session replay; reduces tool sprawl
- Integrated data warehouse; run your own queries without sampling
- Built-in experimentation and A/B testing; no third-party tool needed
Cons
- Not designed for infrastructure or application performance monitoring
- Best suited for product and frontend teams; limited backend/DevOps features
SigNoz
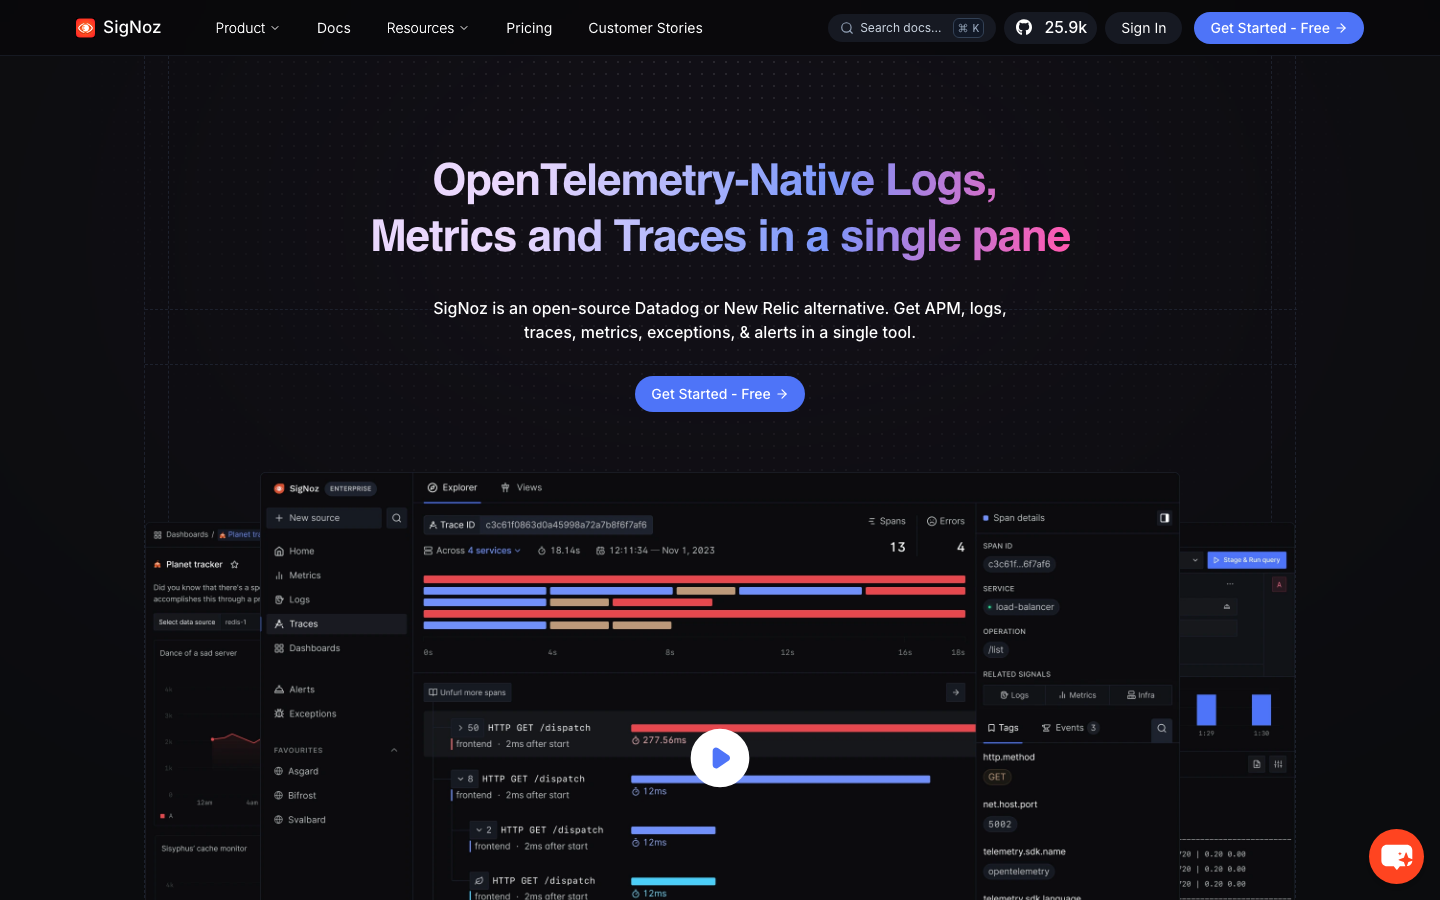
An open-source observability platform native to OpenTelemetry that unifies logs, traces, and metrics in a single application. Positioned as a direct Datadog alternative with no vendor lock-in and transparent, predictable pricing.
Pros
- True full-stack observability (logs, traces, metrics) in one platform
- Native OpenTelemetry support; future-proof instrumentation
- Self-hosted; full data control and no surprise billing
Cons
- Smaller community and ecosystem than Prometheus + Grafana
- Still maturing; fewer integrations and advanced features than commercial competitors
How to choose
Start with your pain point. If Datadog's bill is the issue, any self-hosted solution (Prometheus + Grafana, Netdata, or SigNoz) eliminates the per-event pricing trap. If you need a drop-in replacement with logs, traces, and metrics bundled, SigNoz is the closest match. For infrastructure-heavy teams, Prometheus + Grafana is the safest, most battle-tested path. If you're managing containers at scale, Netdata offers the fastest time-to-value. For teams already investing in log analytics or high-volume event storage, ClickHouse is unbeatable on cost and query power. Smaller teams or those with simpler needs should evaluate Uptime Kuma for uptime, Sentry for errors, or PostHog for product analytics before committing to a full observability stack.