


TL;DR
- Real-time infrastructure observability at scale: netdata combines full-stack metrics collection with minimal overhead, ideal for teams drowning in log ingestion bills.
- Time-series analytics without per-GB fees: ClickHouse handles massive event volumes with columnar compression, replacing Splunk's volume-based pricing model entirely.
- Error tracking and performance monitoring: Sentry gives developers native visibility into application errors and transactions without the licensing complexity of enterprise Splunk deployments.
Why teams leave Splunk
Splunk's cost structure is the primary driver. At roughly $4.00 per GB for log ingestion, organizations with high-volume environments face unpredictable and escalating bills—compounded by a 150% overage penalty when usage exceeds subscribed limits. This volume-based pricing makes budgeting nearly impossible in dynamic environments where log volume fluctuates.
Beyond cost, Splunk's proprietary architecture creates lock-in. Self-hosting the enterprise stack is expensive and operationally complex, and extracting data for migration or compliance purposes is non-trivial. Teams also lose flexibility: dashboard and query capabilities are constrained by licensing tiers, and data sampling becomes necessary at scale, degrading observability precision when you need it most.
The shift to open-source alternatives reflects a broader move toward data sovereignty and cost predictability. Self-hosted or cloud-deployed open platforms eliminate per-event billing, allow full query flexibility, and keep data under your control.
Quick comparison
| Name | License | Self-Hosted | Data Ownership | Query Flexibility | Best For |
|---|---|---|---|---|---|
| netdata | GPL-3.0 | ✓ Full | ✓ Complete | ✓ High (real-time streaming) | Infrastructure & system metrics |
| prometheus | Apache-2.0 | ✓ Full | ✓ Complete | ✓ High (PromQL) | Time-series metrics & alerting |
| worldmonitor | License not declared | ✓ Full | ✓ Complete | ✓ High (AI-driven queries) | Geopolitical & situational awareness |
| ClickHouse | Apache-2.0 | ✓ Full | ✓ Complete | ✓ Very High (SQL) | High-volume event analytics |
| Sentry | License not declared | ✓ Full | ✓ Complete | ✓ High (custom dashboards) | Application error & performance tracking |
| goaccess | MIT | ✓ Full | ✓ Complete | ✓ Medium (log analysis) | Web server log analysis |
| druid | Apache-2.0 | ✓ Full | ✓ Complete | ✓ Very High (SQL) | Real-time OLAP analytics |
| homer | AGPL-3.0 | ✓ Full | ✓ Complete | ✓ High (packet inspection) | VoIP & RTC packet capture |
Top open-source alternatives to Splunk
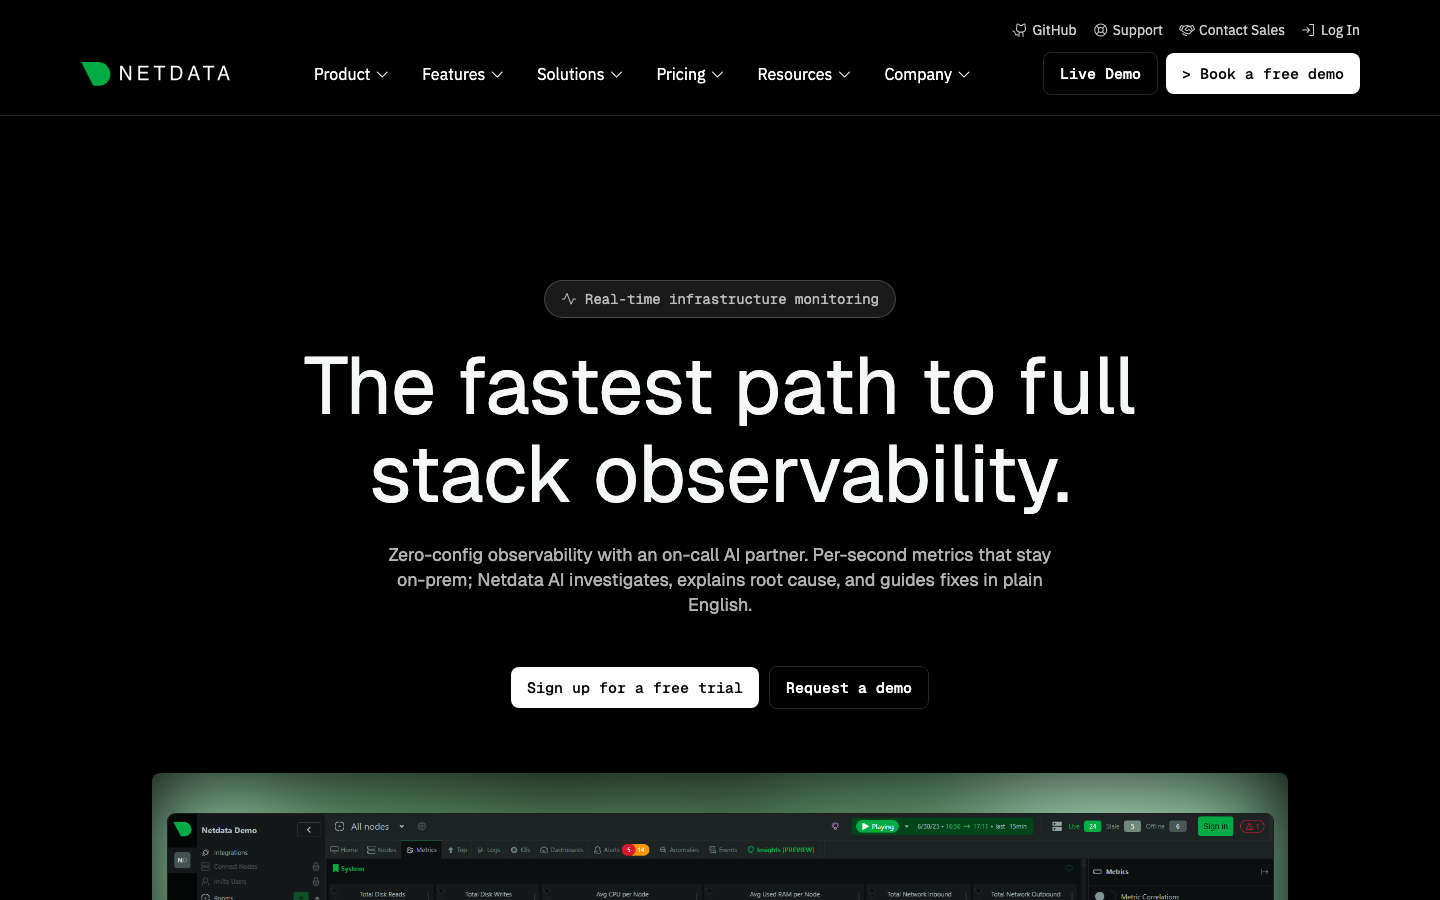
netdata
netdata is a lightweight, distributed monitoring agent that streams real-time metrics from every layer of your infrastructure—systems, containers, applications—directly to a local or centralized database. It's designed for speed and minimal resource overhead, making it viable even on resource-constrained environments.
Pros:
- Instant infrastructure visibility with sub-second metric granularity; no sampling lag.
- Minimal CPU and memory footprint compared to heavyweight collectors; scales to thousands of nodes without infrastructure bloat.
- Full data ownership; deploy on-premises or in your own cloud account.
Cons:
- Primarily a metrics platform; less suited for unstructured log analysis than Splunk.
- Smaller ecosystem for custom integrations compared to Splunk's marketplace.
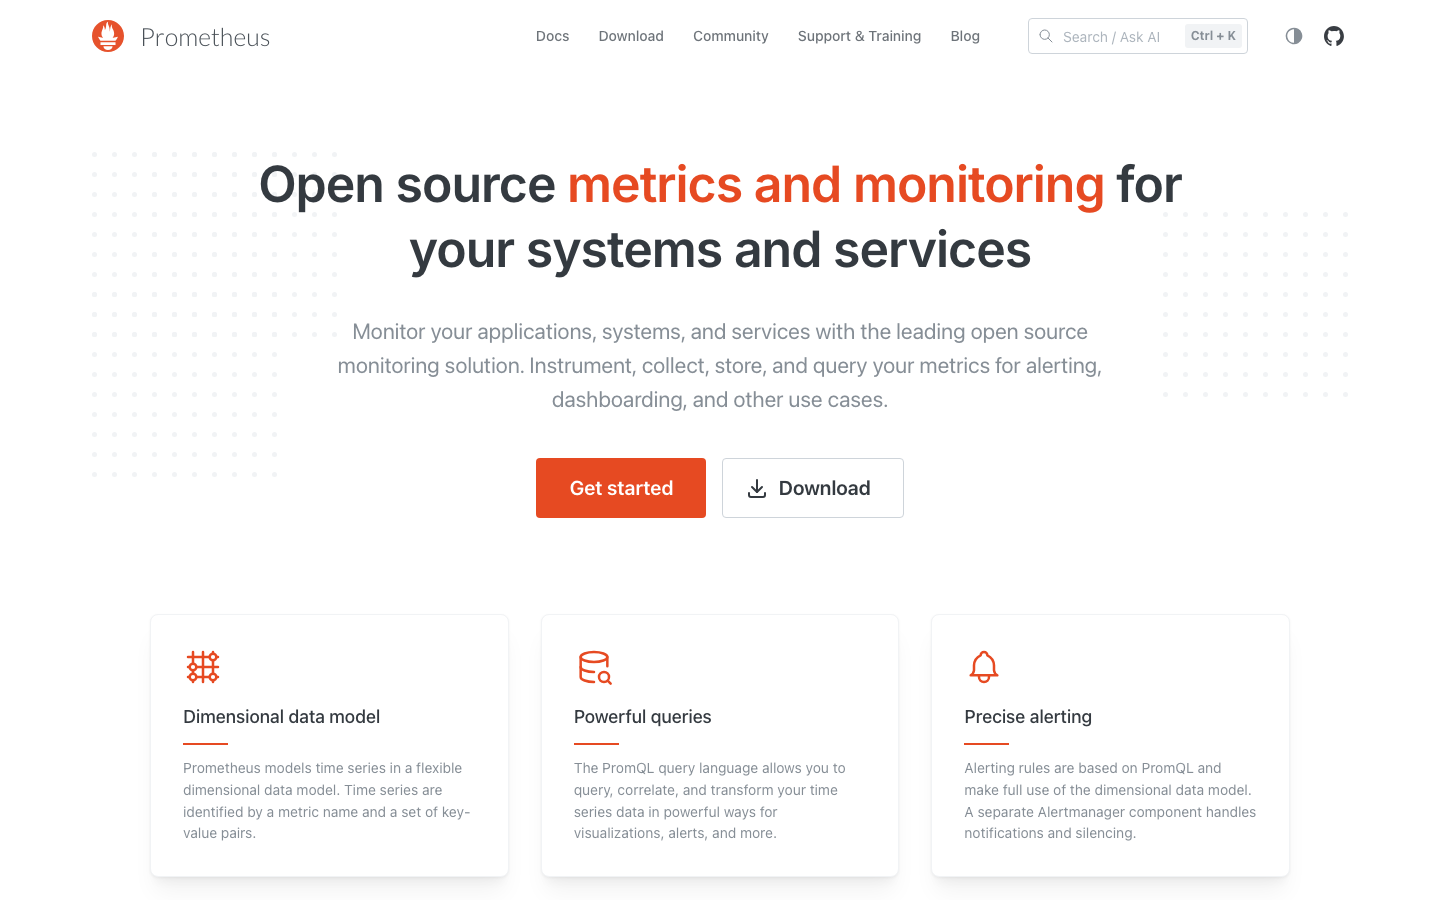
prometheus
Prometheus is the de facto open-source standard for metrics collection and time-series storage. It uses a pull-based model (scraping targets at intervals) and a powerful query language (PromQL) for aggregation, alerting, and dashboarding.
Pros:
- Industry-standard; massive ecosystem of exporters, integrations, and Grafana dashboards.
- Extremely efficient time-series compression; handles billions of metrics on modest hardware.
- Transparent alerting rules; conditions are human-readable and version-controlled.
Cons:
- Pull-based architecture requires targets to be discoverable; less suited for ephemeral workloads without service discovery.
- Not designed for high-cardinality logs or unstructured data; metrics-only platform.
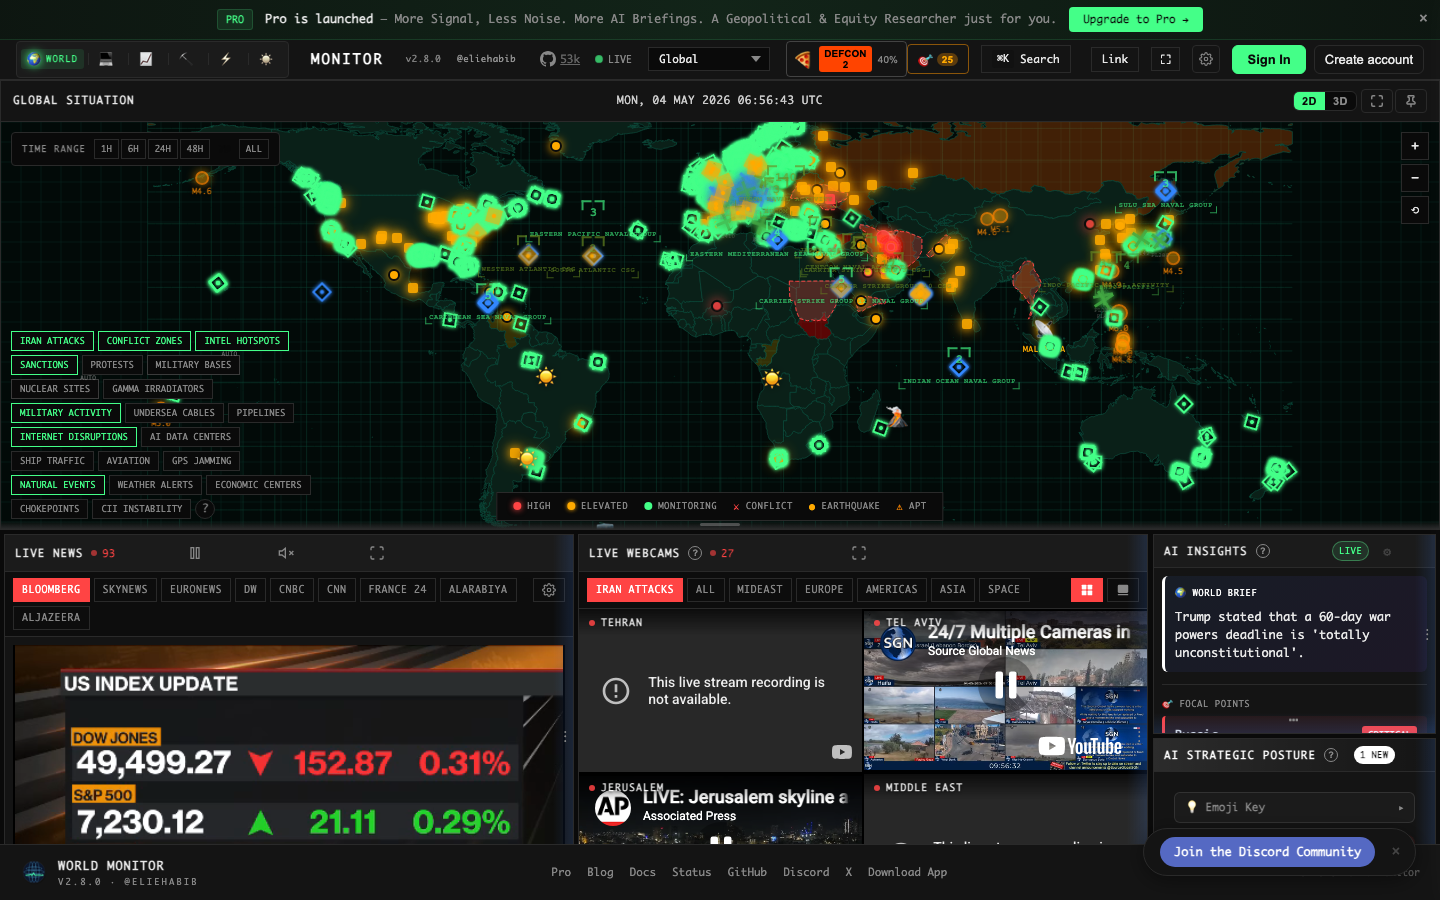
worldmonitor
worldmonitor is an AI-powered global intelligence dashboard that aggregates news, geopolitical events, and infrastructure signals into a unified real-time situational awareness interface. It combines open-source data feeds with machine learning to surface anomalies and trends.
Pros:
- Unique approach: correlates external intelligence (news, geopolitical) with infrastructure metrics for holistic awareness.
- AI-driven anomaly detection and pattern recognition across disparate data sources.
- Real-time dashboard with interactive filtering and drill-down.
Cons:
- Narrower scope than Splunk; focused on geopolitical and situational intelligence rather than general-purpose log analytics.
- Smaller community and fewer third-party integrations.
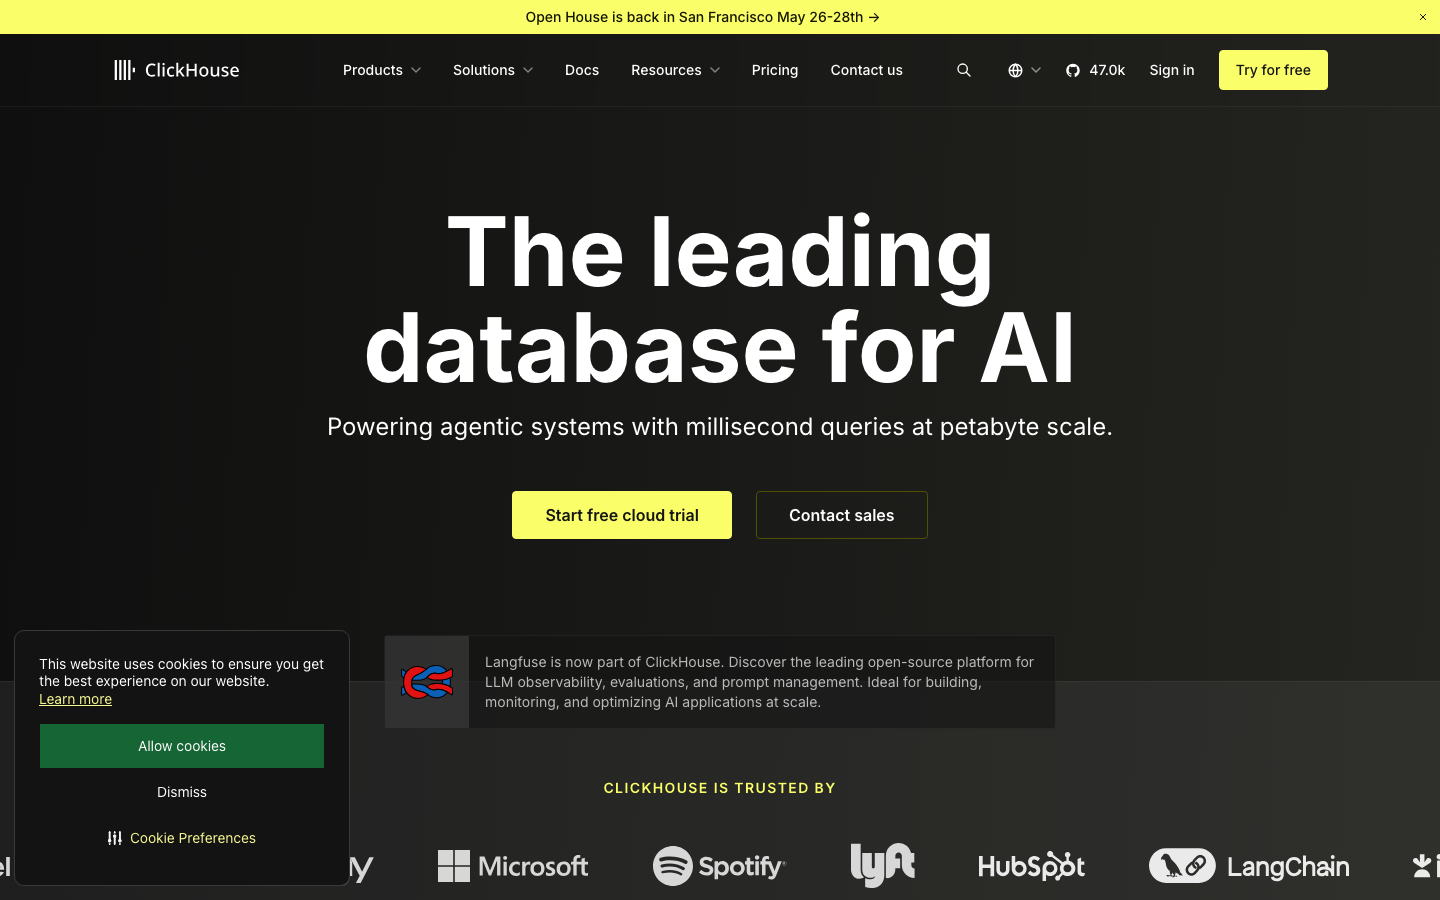
ClickHouse
ClickHouse is a columnar OLAP database optimized for analytical queries over massive event volumes. It compresses data efficiently and executes SQL queries at scale, making it a direct competitor to Splunk's indexing approach but without per-GB ingestion fees.
Pros:
- Exceptional compression and query speed on high-volume datasets; easily handles petabyte-scale events.
- Standard SQL interface; no vendor-specific query language to learn.
- Cost-predictable: pay for storage and compute, not per event ingested.
Cons:
- Requires more operational expertise to tune and manage than managed Splunk.
- Not a complete observability platform; you'll need to add log shippers, dashboarding, and alerting separately.
Sentry
Sentry is a developer-first error tracking and performance monitoring platform. It captures exceptions, performance regressions, and session replays from web and mobile applications, providing context-rich debugging without manual log parsing.
Pros:
- Purpose-built for application observability; developers get stack traces, breadcrumbs, and session context automatically.
- Low operational overhead; SDKs handle ingestion and sampling intelligently.
- Actionable alerts tied directly to code and releases.
Cons:
- Specialized for application errors and performance; not a general-purpose log or metric platform.
- Less useful for infrastructure or non-application system monitoring.
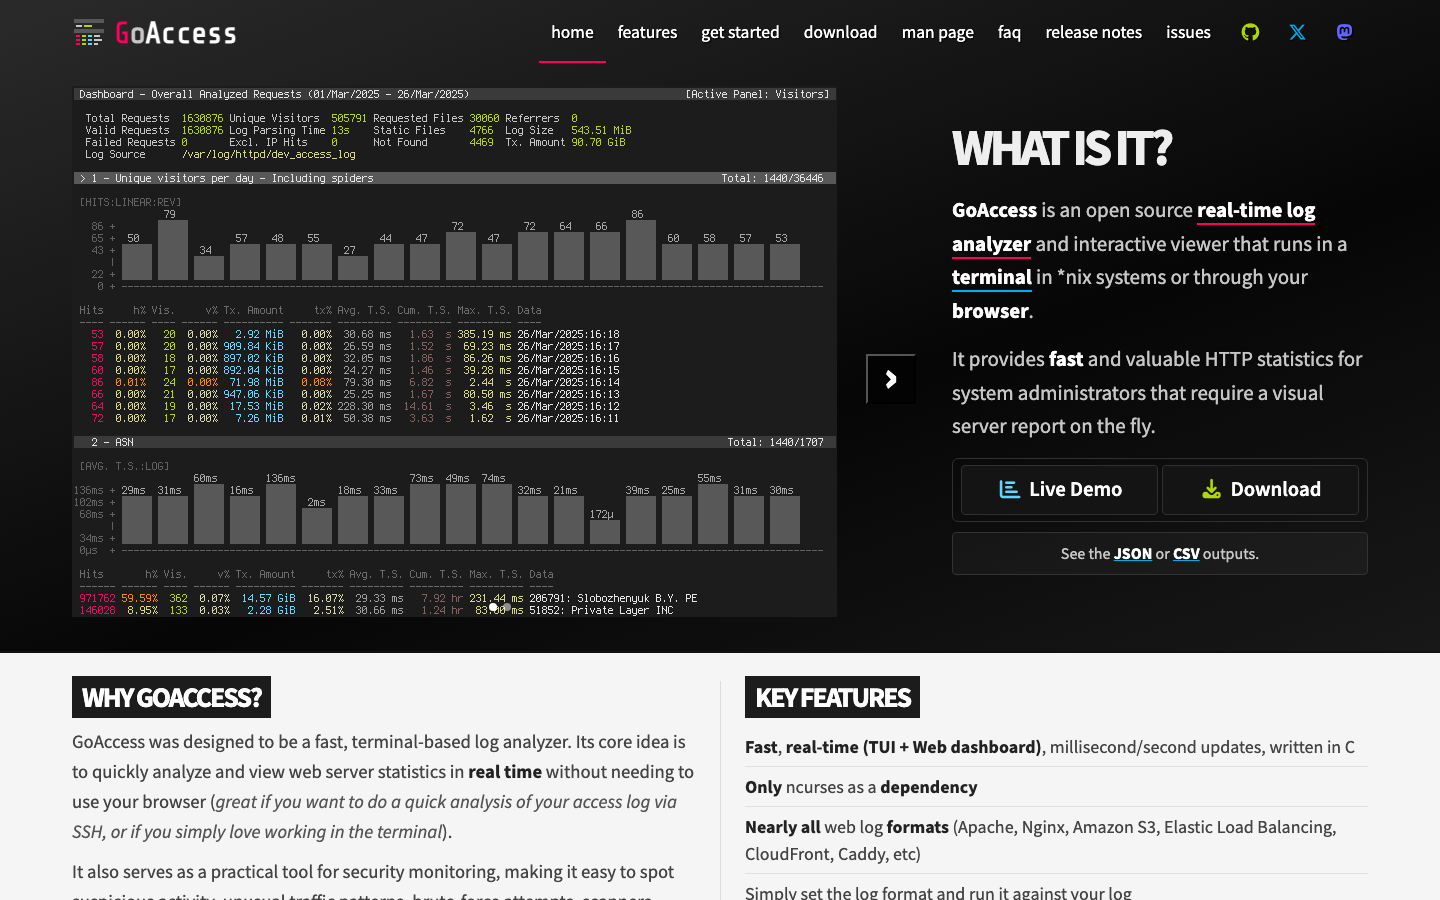
goaccess
GoAccess is a lightweight, real-time web log analyzer that runs in a terminal or browser. It parses common web server logs (Apache, Nginx) and renders interactive dashboards showing traffic patterns, status codes, and geographic distribution.
Pros:
- Minimal dependencies; runs on any Unix-like system with no database setup required.
- Real-time log tail analysis; immediate visibility into live traffic.
- Interactive terminal UI and HTML report generation.
Cons:
- Designed specifically for web server logs; not a general-purpose event analytics platform.
- Limited to retrospective log analysis; no long-term storage or complex correlation queries.
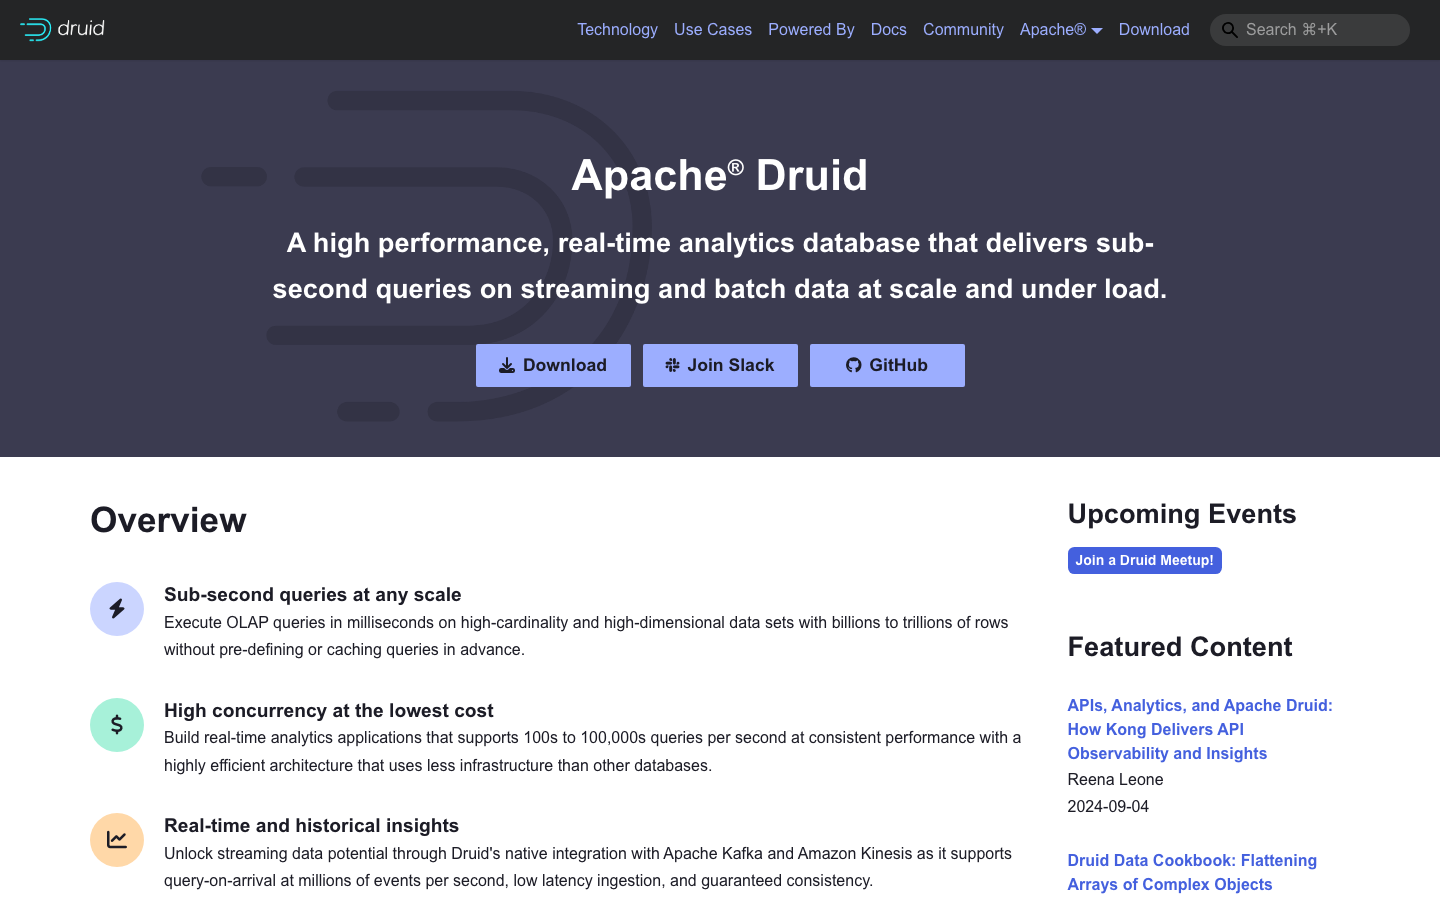
druid
Apache Druid is a high-performance real-time OLAP database designed for fast exploratory analytics over massive event streams. It combines columnar storage, bitmap indexing, and in-memory caching to deliver sub-second query latency on billions of rows.
Pros:
- Exceptional query speed on high-cardinality data; scales to petabyte-scale event volumes.
- Native support for time-series rollups and approximate aggregations for real-time dashboards.
- SQL and native query APIs; integrates with Superset, Grafana, and other BI tools.
Cons:
- Steeper operational learning curve; requires tuning of segments, partitioning, and retention policies.
- Java-based; higher memory footprint than lighter alternatives like Prometheus.
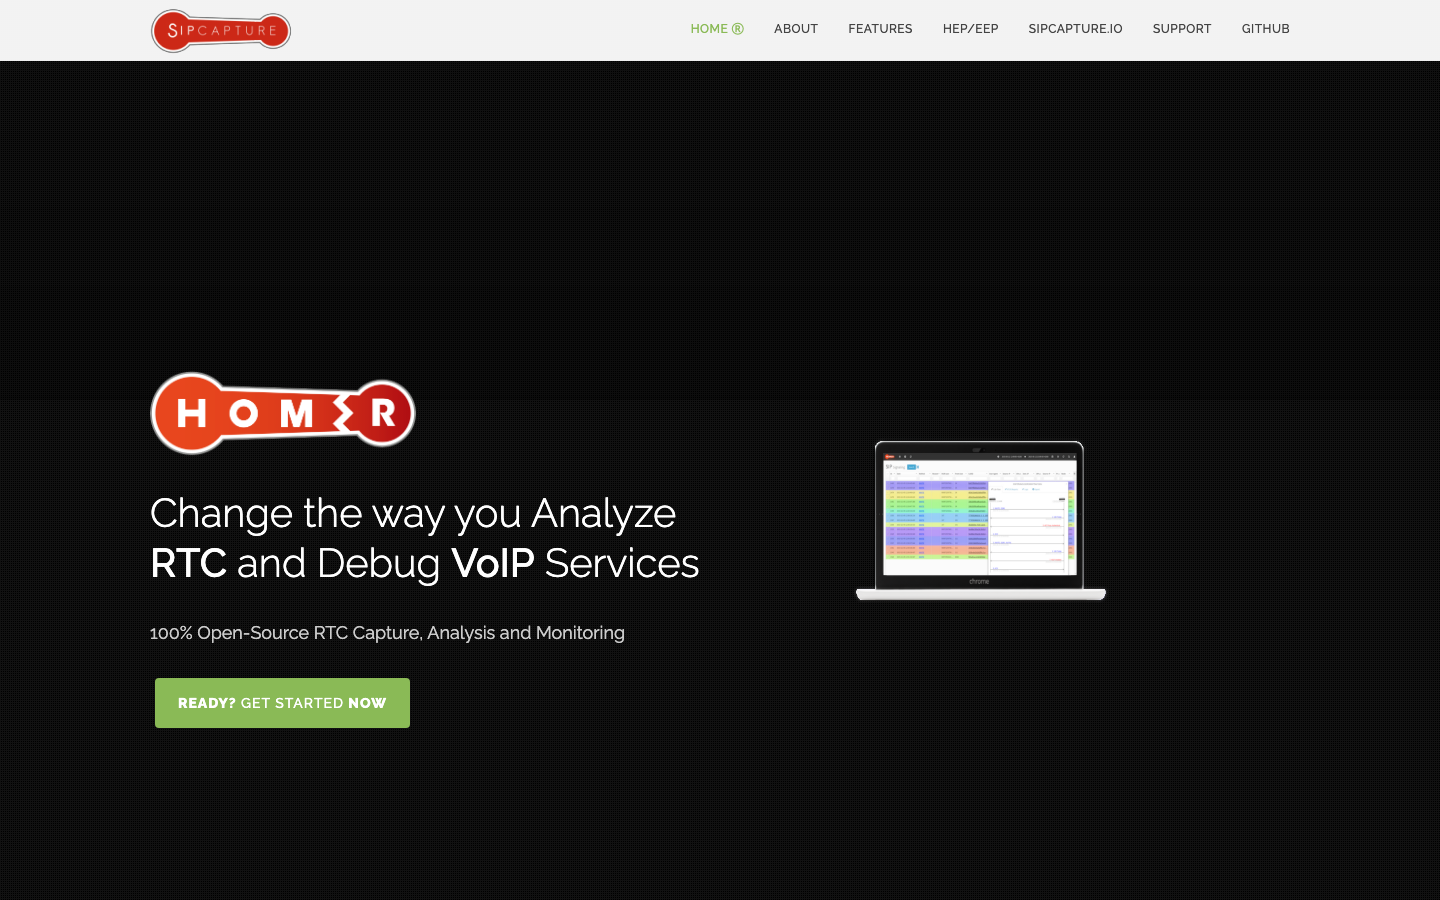
homer
HOMER is a 100% open-source platform for SIP, VoIP, and RTC packet capture and monitoring. It records, indexes, and analyzes session initiation protocol traffic, call quality metrics, and signaling events in real time.
Pros:
- Specialized expertise in telecom and real-time communications monitoring; no Splunk alternative matches this depth.
- Full packet capture and replay; forensic-grade call analysis.
- Compliant with telecom industry standards and regulations.
Cons:
- Extremely narrow use case; only relevant for VoIP and RTC environments.
- Not applicable as a general-purpose Splunk replacement for most organizations.
How to choose
Start with your primary use case: metrics (choose Prometheus or netdata), high-volume events (ClickHouse or Druid), or application errors (Sentry). For teams with modest infrastructure and tight budgets, netdata + Prometheus covers 80% of Splunk's observability scope at a fraction of the operational cost. If you're ingesting terabytes of logs monthly, ClickHouse eliminates Splunk's per-GB penalty immediately. For specialized domains—web logs (goaccess), geopolitical intelligence (worldmonitor), or VoIP (homer)—choose the tool built for that problem. Most teams end up combining 2–3 open-source projects rather than replacing Splunk with a single monolith.